XAU/USD Trading Signal and Technical Analysis for February 3, 2026
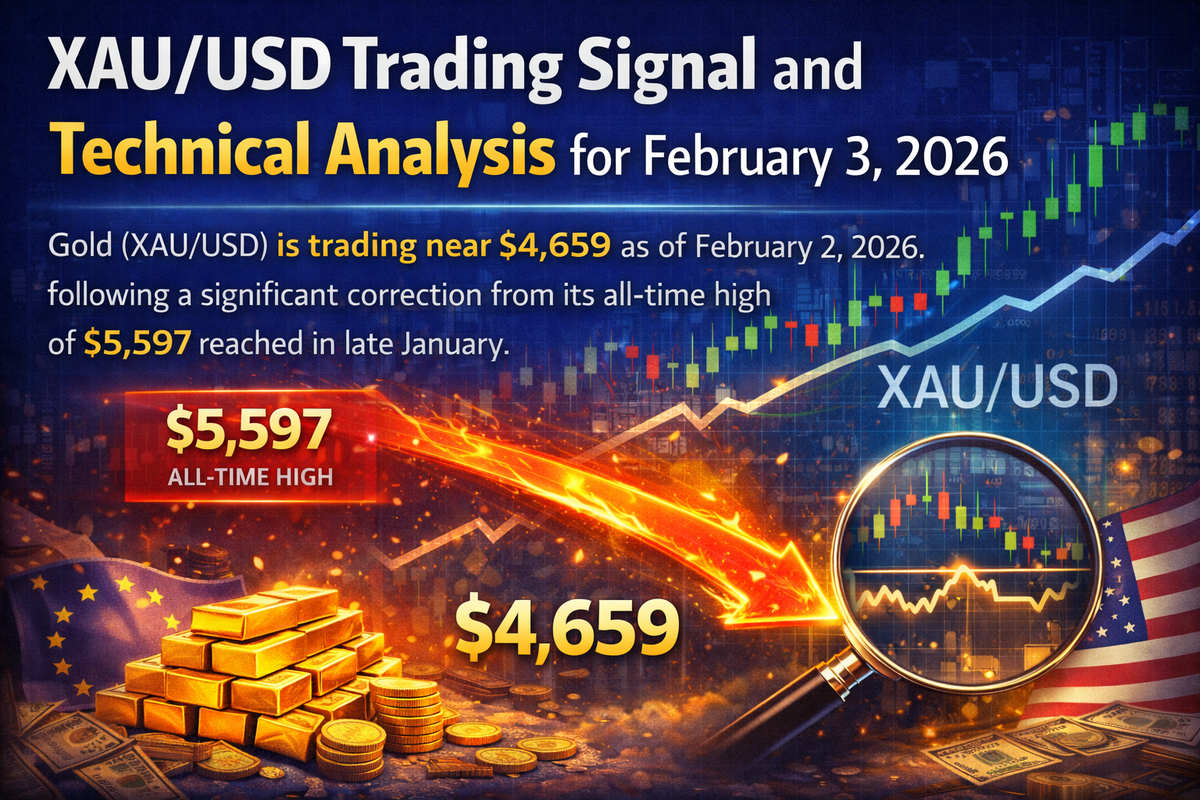
Gold (XAU/USD) is trading near $4,659 as of February 2, 2026, following a significant correction from its all-time high of $5,597 reached in late January. The precious metal has experienced a sharp 17% drawdown following the nomination of Kevin Warsh as the next Federal Reserve Chair, triggering a hawkish shift in monetary policy expectations. This comprehensive analysis examines multiple technical indicators, fundamental drivers, and market dynamics to provide actionable trading signals for February 3, 2026.
Trading Signal Summary
Direction: BULLISH BIAS (BUY on dips)
Entry Zone: $4,620 - $4,665
Target 1: $4,850 (Short-term)
Target 2: $5,100 (Medium-term)
Target 3: $5,280 - $5,400 (Extended target)
Stop Loss: $4,545 (daily close below)
Risk-Reward Ratio: 1:3 to 1:5
Confidence Level: 75-80%
Alternate Bearish Scenario: If price breaks below $4,550 with confirmation, expect decline toward $4,350-$4,380 support zone.
Current Market Structure
Price Action Analysis
Gold has completed a healthy corrective phase after its parabolic rally that saw prices surge 259.57% over the past year. The current pullback from $5,597 to approximately $4,659 represents a 38.2% Fibonacci retracement, which is the most common and healthy pullback level in strong uptrends. This technical correction, while steep in absolute terms, demonstrates classic "buy the dip" characteristics within an intact bullish structure.
The precious metal continues to trade within a bullish channel that has been intact throughout the rally. Moving averages indicate an uptrend, with prices having broken above signal lines earlier in the month, confirming buying pressure and potential for further growth. The market experienced extreme selling pressure following Friday's dramatic reversal when Kevin Warsh's nomination triggered concerns about a more hawkish Federal Reserve policy path.
Critical Support Levels
Multiple technical frameworks converge to identify key support zones that will likely determine the market's direction on February 3:
Primary Support Zone: $4,615 - $4,640
This level represents the 61.8% Fibonacci retracement from recent swing highs. The 38.2% retracement at $4,665 has already been tested, and the 61.8% level represents deeper support where institutional buying typically emerges.
Secondary Support: $4,550 - $4,575
Technical forecasts identify this as a critical support floor where the market will either stabilize or face deeper corrections. This zone aligns with the lower boundary of the ascending channel and represents the last line of defense before a more significant trend reversal.
Tertiary Support: $4,350 - $4,380
Should the primary support levels fail, this deeper support zone provides additional backing for gold prices. A decline to this level would represent a more substantial correction but would still maintain the longer-term bullish structure.
Key Resistance Levels
Immediate Resistance: $4,850 - $4,880
This level represents the first hurdle for bullish momentum recovery and aligns with short-term moving averages that have rolled over during the correction.
Major Resistance: $5,000 - $5,111
The psychological $5,000 level presents significant resistance. Gold tested resistance at $5,111 before the correction began, and a breakout above this level would signal renewed strength. Weekly forecasts suggest that failure to hold above $5,000 could trigger additional downside pressure toward support zones.
Extended Resistance: $5,205 - $5,280
A breakout above $5,205 would confirm the resumption of the asset's upward trend and open the path toward targets above $5,975 in the coming weeks. The $5,280 level represents analyst targets based on trend continuation patterns.
Technical Indicator Deep Dive
Relative Strength Index (RSI)
The RSI currently reads between 62-65 on the 4-hour chart, indicating optimal bullish positioning. This reading is particularly significant because:
- Not Overbought: The RSI maintains substantial room for upside movement to 70+ before momentum exhaustion occurs
- Healthy Pullback: The RSI remained healthy throughout the pullback from $5,597 to current levels, indicating consolidation rather than reversal
- No Bearish Divergence: The absence of bearish divergence patterns suggests underlying strength remains intact
- RSI Divergence Pattern: Some analysis indicates potential RSI divergence suggesting a possible correction in upcoming sessions, which traders should monitor closely
An additional bullish signal would be a rebound from the bullish trendline on the RSI, which would support continued upward momentum during the week of February 2-6, 2026.
Moving Average Convergence Divergence (MACD)
The MACD indicator currently shows a bullish configuration with the MACD line crossing above the signal line, suggesting potential upward momentum. This crossover occurred despite the recent selling pressure, indicating that underlying momentum may be shifting back in favor of buyers. Historical analysis of MACD-based trading strategies demonstrates improved performance when combined with other momentum indicators like RSI and Money Flow Index.
The MACD histogram's behavior over the next 24-48 hours will be critical. Expanding green bars would confirm strengthening bullish momentum, while contracting or red bars could signal continued consolidation or weakness.
Exponential Moving Averages (EMA)
Key EMA levels provide dynamic support and resistance zones:
Daily EMA Levels:
- 50 EMA: $4,650
- 100 EMA: $4,625
- 200 EMA: $4,605
- 400 EMA: $4,585
4-Hour EMA Levels:
- 50 EMA: $4,655
- 100 EMA: $4,630
- 200 EMA: $4,612
- 400 EMA: $4,590
The current price action near these moving averages suggests a consolidation phase. A decisive move above the 50 EMA on both timeframes would indicate renewed buying interest, while sustained trading below the 200 EMA could signal extended weakness.
Fibonacci Retracement Analysis
The current correction has brought gold to the critical 38.2% Fibonacci retracement level at $4,665, measured from the recent swing low to the $5,597 high. This represents a textbook "buy the dip" setup, as the 38.2% level is the most common and healthy pullback zone in strong uptrends.
Key Fibonacci levels for February 3 trading:
- 23.6%: $4,665
- 38.2%: $4,640
- 61.8%: $4,615
If the market respects the 38.2% retracement, traders can expect a bounce toward previous highs. A deeper move to the 61.8% level at $4,615 would still maintain bullish structure but would require more time to recover.
Pivot Points
Weekly Pivots:
- Pivot Point: $4,650
- Resistance 1: $4,680
- Support 1: $4,620
Daily Pivots:
- Pivot Point: $4,655
- Resistance: $4,675
- Support: $4,635
These pivot levels suggest that February 3 will likely see range-bound trading between $4,620 and $4,680 unless a significant catalyst emerges.
Order Blocks and Supply/Demand Zones
Order blocks represent areas where significant institutional buying or selling has occurred. Current order blocks are located near the support levels mentioned above, particularly in the $4,550-$4,575 zone. These zones often act as magnets for price action as institutional players accumulate positions.
Fundamental Analysis
Federal Reserve Policy and Kevin Warsh Nomination
The nomination of Kevin Warsh as the next Federal Reserve Chair represents the most significant fundamental development impacting gold prices in February 2026. Warsh's appointment triggered a sharp reversal in bullion's uptrend due to expectations of a potentially more hawkish interest rate path.
Warsh's Policy Stance:
Warsh carries a hawkish reputation, which initially pressured gold prices. However, his recent positioning suggests a more nuanced approach. He has argued that robust economic growth does not necessarily lead to heightened inflation, particularly when accompanied by rising productivity from artificial intelligence adoption. This productivity-driven growth thesis could support lower rates without inflationary consequences, potentially providing long-term support for gold.
Analysts at Evercore ISI note that "Given his hawkish reputation and perceived independence, Warsh is in a stronger position to encourage the FOMC to implement at least two, and possibly three, cuts this year". This assessment suggests that while initial market reactions were bearish, the longer-term policy path may be more accommodative than feared.
Interest Rate Trajectory:
The Federal Reserve has delivered 175 basis points of cuts since September 2024, with the policy rate currently at 4.25-4.50%. The central bank appears positioned for an extended pause on rate reductions, with the 19-member committee significantly divided on future policy direction. Several members believe adequate accommodation has been provided to address concerns about slowing job growth.
President Trump's stated desire for interest rates near 1% faces significant obstacles, as the current economic environment of steady growth does not support such ultra-low rates. This tension between political pressure and economic reality creates uncertainty that typically supports safe-haven demand for gold.
US Dollar Index (DXY) Dynamics
The US Dollar Index sits at a critical juncture near 96.00-97.00, representing a four-month low and a crucial support zone. The dollar has declined sharply from late-2025 highs, falling approximately 4% and testing long-term support that has held multiple times since 2021.
Gold-Dollar Inverse Correlation:
The inverse relationship between gold and the US dollar remains a primary driver of XAU/USD price action. When the DXY index rises, it strengthens the dollar relative to other currencies, making gold more expensive for international buyers and suppressing demand. Conversely, a falling DXY index makes gold relatively cheaper for foreign buyers, increasing demand and driving prices higher.
The current weakness in the dollar index provides a "classic tailwind to XAU/USD as non-US buyers find gold more affordable". If the DXY breaks below 96.00 decisively, it could trigger a renewed surge in gold prices as dollar weakness accelerates.
Critical DXY Levels:
The 96.00-97.00 support zone represents a decision point for broader market dynamics. Technical analysis suggests that "if the dollar holds here, the impact on gold, commodities, equities, and global liquidity will look very different than if it breaks lower". A breakdown below this level would likely coincide with gold rallying toward $5,000 and beyond, while stabilization could allow for continued consolidation in gold.
Geopolitical Risk Premium
Geopolitical tensions continue to underpin safe-haven demand for gold, though their impact has been somewhat muted during the recent correction. Multiple flashpoints contribute to elevated risk premiums:
Middle East Tensions:
Ongoing instability in the Middle East remains unresolved, with tensions between Israel and Iran continuing to simmer. Israeli Prime Minister Benjamin Netanyahu stated that Israel is closely monitoring rearmament activities of Hamas, Hezbollah, and Iran, signaling potential for renewed confrontation. These geopolitical risks traditionally drive investors toward safe-haven assets like gold.
Historical precedent shows that Middle East conflicts significantly impact gold prices. During previous escalations, gold surged to near-term highs as investors sought protection. The persistent instability across the Middle East, Eastern Europe, Asia, and Latin America continues to support strategic allocations toward defensive assets.
US-NATO Friction and Tariff Uncertainty:
Additional geopolitical concerns include US-NATO friction over Greenland and ongoing tariff uncertainty, which fuel market volatility and support gold's safe-haven appeal. President Trump's tariff threats and trade policy unpredictability create an environment of heightened uncertainty that historically benefits gold.
Research indicates that negative geopolitical shocks increase commodity return volatility more than positive shocks, with gold particularly sensitive to geopolitical threat events. This asymmetric response means that any escalation in global tensions would likely provide stronger support for gold than de-escalation would pressure it.
Central Bank Gold Accumulation
Central bank gold purchases represent a crucial structural support for gold prices, though the pace is expected to moderate in 2026. Key developments include:
Continued Buying Trend:
Survey data reveals that 95% of central banks expect to increase gold reserves in 2026, with projected purchases around 755 tonnes. This remains well above long-term averages, reflecting sustained diversification away from traditional reserve assets. Poland, Brazil, and China continue to dominate central bank purchases.
Moderating Pace:
While the structural trend toward gold accumulation is expected to persist, momentum may moderate in 2026 as risk premiums cool and macroeconomic conditions stabilize. The heightened global uncertainty and increasing skepticism toward the US dollar as the dominant reserve currency drove a sharp surge in recent years, but this exceptional buying may transition to a more measured pace.
Dollar Dynamics Impact:
The relationship between dollar strength and central bank buying is complex. A stronger dollar in the second half of 2026, particularly due to growth differentials between the US and Europe, could emerge as a headwind for gold prices and temper central bank demand. However, any easing in geopolitical tensions could reduce the urgency for aggressive reserve accumulation.
Inflation Environment
The US inflation landscape presents a mixed picture that influences gold's appeal as an inflation hedge:
Current Inflation Data:
The US Consumer Price Index (CPI) stands at 2.7% year-over-year as of December 2025, with core inflation at 2.6%, the lowest level since 2021. These readings came in below expectations, with the core rate at 0.2% month-over-month versus forecasts of 0.3%.
February 2026 Expectations:
Market forecasts for February 2026 CPI suggest continued moderate inflation, with most projections clustering between 2.4% and 2.8% year-over-year. On a month-over-month basis, headline CPI is expected to increase by 0.3%, with core CPI also rising 0.3%, driven mainly by higher goods prices.
Implications for Gold:
While current inflation levels are relatively moderate, uncertainty surrounding US tariff policy has market observers concerned about a potential rebound in price pressures. This uncertainty supports gold's role as an inflation hedge, particularly if policy-induced price increases materialize in coming months. Historical analysis confirms that gold serves as an effective hedge against inflation and currency debasement risks.
Market Sentiment and Positioning
Institutional Analysis
Market structure suggests a "healthy correction" that helps clear out excessive speculation and overexcitement following the parabolic January rally. The rapid $570 decline over two days represented profit-taking by institutional players rather than a fundamental shift in the bullish thesis.
Analysts characterize the current environment as consolidation near critical Fibonacci support levels, with the technical picture reflecting a "phase of a strong trend rally". The baseline scenario suggests either short-term consolidation near current levels or continued growth after a brief pause.
Price Forecast Consensus
Multiple forecasting sources provide targets for February 2026:
Short-Term Forecasts:
- CoinCodex projects gold prices around $4,653-$4,783 per ounce for February 2026
- LongForecast.com anticipates an average of $5,166 for February, with a high of $5,846 and low of $4,370
- Forex24.pro suggests an attempt at bearish correction to test $4,575 support before potential upward rebounds toward $5,975
Medium-Term Targets:
- DailyForex analysis views pullbacks as potential buying opportunities with an eye on the $4,800 level as an area of extreme value
- TradersUnion forecasts XAU/USD prices between $3,458 and $3,851 for February through April 2026 in their conservative scenarios
- Intellectia.AI maintains that key resistance at $5,111 with support at $4,500-$4,550 provides the technical framework for February price action
The consensus suggests high volatility with a bias toward consolidation followed by resumption of the uptrend, provided key support levels hold.
Trading Strategy for February 3, 2026
Primary Bullish Setup (Recommended)
Entry Strategy:
Implement a scaled entry approach between $4,620 and $4,665, with larger position sizes allocated near the lower end of the range. This approach allows traders to average into positions while managing risk if the market tests deeper support levels.
Entry Trigger:
Wait for confirmation signals before entering:
- RSI rebound from the bullish trendline on lower timeframes (1H or 4H charts)
- MACD histogram shifting to green or expanding on the 4H chart
- Bullish candlestick patterns (hammer, bullish engulfing) forming at support levels
- Volume spike indicating accumulation rather than distribution
Position Sizing:
Allocate 30-40% of intended position size at current levels around $4,655-$4,665, 30-40% at $4,635-$4,640 (38.2% Fibonacci), and reserve 20-30% for potential deeper dip to $4,615-$4,620 (61.8% Fibonacci).
Target Management:
- Target 1 ($4,850): Scale out 30-40% of position to secure profits and reduce risk. This target represents near-term resistance and short-term moving averages.
- Target 2 ($5,100): Close an additional 30-40% of position. This level represents major psychological resistance and the breakdown point of the recent correction.
- Target 3 ($5,280-$5,400): Allow remaining position to run with a trailing stop to capture extended upside if momentum accelerates.
Stop Loss Management:
Set initial stop loss at $4,545 (daily close basis). This level sits below the critical $4,550-$4,575 support zone and provides adequate breathing room for intraday volatility while protecting against a more significant trend reversal. Once the position moves into profit, implement a trailing stop or move stop to breakeven when price reaches $4,750-$4,800.
Risk-Reward Assessment:
With entry near $4,640 and stop loss at $4,545, the risk is approximately $95 per ounce. Target 1 at $4,850 provides $210 reward (2.2:1 ratio), Target 2 at $5,100 offers $460 reward (4.8:1 ratio), and Target 3 at $5,280 delivers $640 reward (6.7:1 ratio). This favorable risk-reward profile justifies the bullish bias.
Alternative Bearish Scenario
Entry Conditions:
Consider short positions only if:
- Price closes below $4,550 on the daily timeframe
- RSI breaks below 50 with increasing momentum
- MACD crosses bearish on the daily chart
- DXY breaks decisively above 97.50, indicating renewed dollar strength
Short Entry Zone:
$4,520-$4,545 on confirmed breakdown
Targets:
- Target 1: $4,380 (deeper Fibonacci support)
- Target 2: $4,350 (major support zone)
- Target 3: $4,155 (channel breakdown level)
Stop Loss:
$4,650 (above breakdown level)
Probability Assessment:
The bearish scenario carries lower probability (20-25%) given the intact bullish structure, healthy Fibonacci retracement, and supportive fundamental backdrop. This setup should only be considered if clear technical breakdowns occur with confirming indicators.
Risk Factors and Considerations
Key Risks to Monitor
Federal Reserve Communications:
Any hawkish statements from Fed officials or Kevin Warsh regarding interest rate policy could trigger renewed selling pressure. Conversely, dovish commentary would likely support gold's recovery.
US Dollar Strength:
A rebound in the DXY above 97.50 would challenge the bullish thesis and could extend gold's correction. Monitor dollar dynamics closely, particularly in relation to the critical 96.00 support level.
Geopolitical Developments:
While geopolitical tensions generally support gold, any meaningful de-escalation in Middle East conflicts or resolution of US-NATO friction could reduce safe-haven demand.
Technical Breakdown:
A daily close below $4,550 would invalidate the bullish structure and open the door to deeper corrections toward $4,350-$4,380 or potentially $4,155.
Volatility Expectations
February 2026 represents a critical inflection point with Trump's tariff threats, Fed independence concerns, and Middle East tensions converging to create unprecedented market volatility. Traders should expect:
- Intraday ranges of $80-$120 as the market digests the recent correction and positions for the next directional move
- Gap openings if weekend geopolitical developments or Fed communications occur
- Whipsaw price action as algorithms and high-frequency traders react to technical level breaks
- Increased volume as institutional players re-establish positions following the shakeout
Conclusion and Final Recommendations
The technical and fundamental analysis for XAU/USD on February 3, 2026, supports a bullish bias with strategic entries on dips toward key support levels. The current price action represents a healthy 38.2% Fibonacci retracement within an intact bullish channel, offering favorable risk-reward opportunities for patient traders.
Key Takeaways:
- Technical Setup: Gold has completed a textbook correction to the 38.2% Fibonacci level, maintaining bullish structure with RSI at optimal levels and MACD showing bullish divergence.
- Support Framework: Critical support at $4,615-$4,665 provides a solid foundation for recovery, with deeper support at $4,550-$4,575 serving as the line in the sand for the bullish scenario.
- Fundamental Support: Despite Kevin Warsh's hawkish reputation, his nuanced policy views, combined with DXY weakness, ongoing geopolitical tensions, and central bank buying, support gold's longer-term uptrend.
- Target Horizon: Initial targets at $4,850 appear achievable in the near term, with extended targets at $5,100-$5,280 possible if momentum confirms.
- Risk Management: Strict adherence to the $4,545 stop loss level is essential, with position scaling recommended to manage the elevated volatility environment.
Trading Signal Confidence: 75-80%
The confluence of technical factors, including healthy Fibonacci retracement, intact bullish channel, optimal RSI positioning, and bullish MACD crossover, combined with supportive fundamental factors such as DXY weakness and geopolitical uncertainty, creates a high-probability bullish setup for February 3, 2026. However, traders must remain vigilant for potential breakdown below $4,550, which would invalidate this thesis and require reassessment.
The current market structure presents what institutional analysts call a "rare convergence" of technical correction completion at ideal Fibonacci levels, critical dollar breakdown potential, and intact bullish structure across all timeframes. For disciplined traders employing proper risk management, the February 3 session offers compelling opportunities to establish or add to long positions in XAU/USD.
Comments ()