XAU/USD Trading Signal and Market Analysis for January 28, 2026
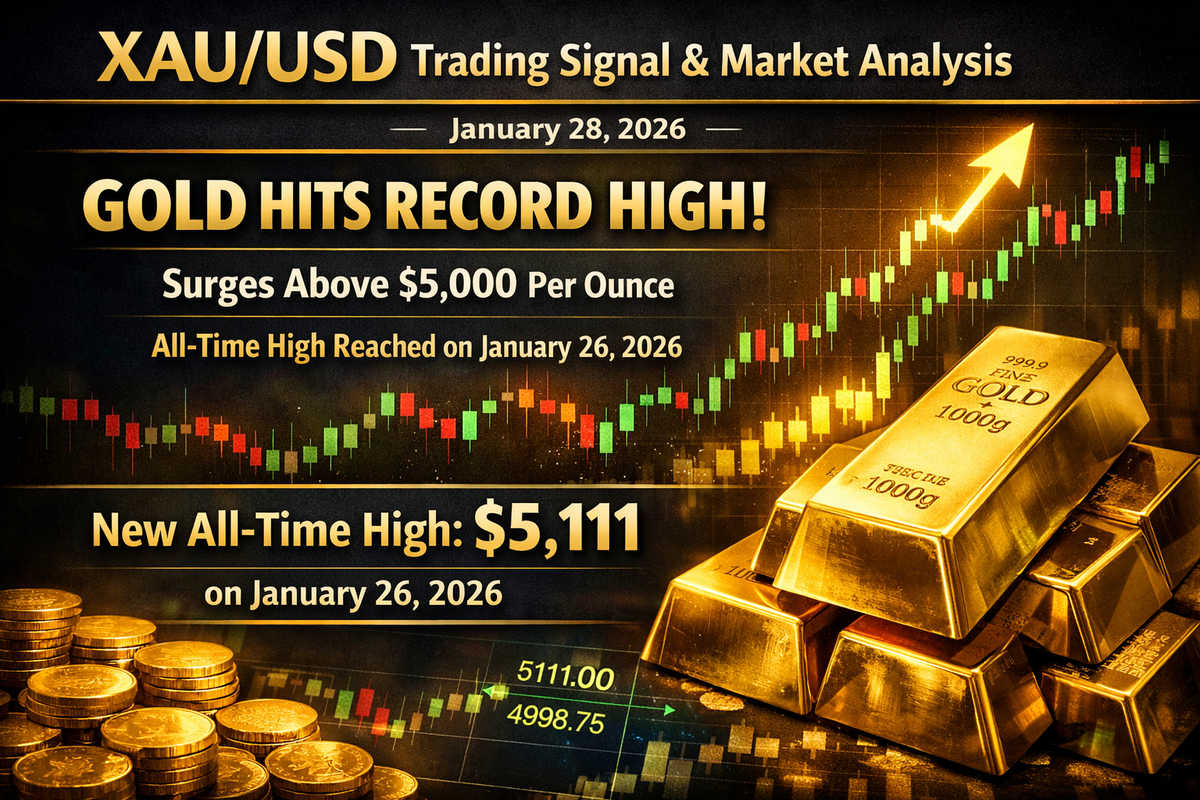
Gold has achieved a historic milestone by surging above the $5,000 per ounce level for the first time on January 26, 2026, reaching an all-time high of $5,111. As of January 27, 2026, XAU/USD is consolidating around the $5,050-$5,100 range, setting up for a critical trading session on January 28 amid the Federal Reserve's policy decision.
Trading Signal for January 28, 2026
Signal Type: LONG (BUY) with caution - Uptrend continuation expected, but with elevated volatility risk
Entry Zones:
- Primary Entry: $5,040 - $5,070 (on minor pullbacks during consolidation)
- Secondary Entry: $4,980 - $5,000 (if deeper retracement occurs before Fed announcement)
Take Profit Levels:
- TP1: $5,145 (conservative target, previous session high)
- TP2: $5,172 (161.8% Fibonacci extension)
- TP3: $5,450 (261.8% Fibonacci extension, extended target)
Stop Loss:
- Conservative: $4,890 (below January 23 low)
- Aggressive: $4,980 (below psychological $5,000 level)
Risk-Reward Ratio: Approximately 1:3 to 1:5 depending on entry and exit strategy
Position Sizing: Reduce position size by 30-40% due to extreme volatility and overbought conditions
Current Market Structure
Price Action Analysis
Gold's price structure demonstrates exceptional bullish momentum within a well-defined ascending channel that began in mid-2025. The precious metal has rallied approximately 19% year-to-date in January 2026, with the current leg higher showing characteristics of an extended third wave in Elliott Wave terminology.
The breakthrough above $5,000 represents not just a psychological milestone but a technical validation of the multi-year uptrend. Following the breakout, prices consolidated between $4,990-$5,111, indicating healthy profit-taking without disturbing the underlying bullish structure.
Technical Indicators Overview
Moving Averages: All major moving averages are aligned bullishly, with price trading well above the 20-day, 50-day, and 200-day exponential moving averages. The 9 EMA sits at approximately $4,854, and the 20 EMA at $4,679, both providing dynamic support levels far below current prices.
Relative Strength Index (RSI): The 14-day RSI has climbed above 80, firmly in overbought territory. This extreme reading suggests the market is overheated in the short term and vulnerable to profit-taking. However, during strong trending markets, RSI can remain elevated for extended periods. Importantly, some analysts note a bearish divergence forming on the RSI, where price makes new highs while RSI fails to confirm, potentially signaling exhaustion.
MACD (Moving Average Convergence Divergence): The MACD indicator remains above the zero line with the histogram showing expanding bullish bars. This configuration indicates accelerating buying pressure rather than deceleration, supporting the continuation thesis. The MACD has not shown any bearish crossover signals, keeping the bullish scenario intact.
Fibonacci Extensions: Using the swing low from November 2025 to the December 2025 high, the 161.8% Fibonacci extension aligns with the $5,100 level, which has acted as immediate resistance. The next extension at 261.8% projects to $5,450, representing the stretched upside target if momentum persists.
Key Support and Resistance Levels
Critical Support Zones:
- $5,040-$5,050: Immediate support zone representing intraday consolidation lows
- $5,000: Major psychological level and broken resistance turned support
- $4,980-$4,990: Secondary support representing Monday's lows
- $4,890: January 23 low, crucial support for maintaining bullish structure
- $4,750-$4,700: Strong support zone at the lower boundary of the ascending channel
- $4,675: Weekly support level
Critical Resistance Zones:
- $5,100: Immediate resistance at 161.8% Fibonacci extension
- $5,111: Session high and current all-time high
- $5,145: Near-term target
- $5,172: Extended Fibonacci level
- $5,200: Psychological round figure
- $5,450: Major upside target at 261.8% Fibonacci extension
Fundamental Analysis
Federal Reserve FOMC Meeting Impact
The most significant catalyst for January 28, 2026, is the Federal Open Market Committee (FOMC) meeting conclusion and policy announcement scheduled for 2:00 PM ET. Market consensus strongly anticipates the Federal Reserve will hold the federal funds rate steady at the current range of 3.5%-3.75%, marking the second consecutive meeting without a change.
This pause comes after three consecutive 25 basis point rate cuts implemented in September, November, and December 2025. The decision to hold rates reflects the Fed's balancing act between a softening labor market and inflation that remains above the 2% annual target.
Key Considerations for Gold:
- Rate Hold Expected: A rate hold is fully priced into markets, so gold's reaction will depend on the tone of the statement and Jerome Powell's press conference at 2:30 PM ET.
- Dot Plot and Forward Guidance: Market participants will scrutinize the updated dot plot projections and any signals regarding the timing of future rate cuts. Current consensus points to limited additional easing (0-2 cuts) in 2026 overall.
- Powell's Tone: Fed Chair Powell's commentary on inflation persistence, labor market conditions, and the central bank's independence amid political pressure will be critical.
- Real Yields: With inflation concerns persisting and rates potentially remaining higher for longer, real yields (nominal yields minus inflation) remain a key driver for non-yielding assets like gold.
US Dollar Weakness
The US Dollar Index (DXY) has weakened significantly, falling to approximately 97.07 on January 27, 2026, down 10% over the last 12 months and sitting near four-month lows. This dollar weakness provides substantial tailwinds for gold, which is priced in dollars and becomes more attractive to foreign buyers when the greenback depreciates.
Several factors are contributing to dollar weakness:
- Concerns about US fiscal policy and rising national debt
- Diminishing confidence in the Federal Reserve's independence
- Trade policy uncertainty and potential coordinated currency intervention in USD/JPY
- Relative monetary policy expectations favoring other currencies
Geopolitical Tensions and Safe-Haven Demand
Geopolitical uncertainty remains elevated, providing continuous support for gold's safe-haven appeal. Key factors include:
Trade Tensions: President Trump announced increases in tariffs on South Korean imports to 25%, including autos, lumber, and pharmaceuticals, expressing dissatisfaction with Seoul's trade commitments. This escalation adds to broader trade uncertainty affecting global markets.
Political Uncertainty: Questions surrounding Federal Reserve independence and legal pressure on Chairman Jerome Powell have raised concerns about monetary policy integrity. These fears support "debasement trades" where investors seek protection from potential currency devaluation.
EU-US Relations: While initial threats regarding Greenland have softened, ongoing uncertainty about transatlantic trade relations continues to support defensive positioning.
Central Bank Accumulation
Central bank gold purchases represent a structural bullish factor that has fundamentally altered the gold market dynamics. China's central bank extended its gold-buying spree for a 14th consecutive month in December 2025, highlighting persistent demand from emerging market central banks.
The World Gold Council's 2025 central bank survey showed the strongest intention to continue buying gold since the survey's initiation in 2019. Central banks added 220 tonnes in Q3 2025 alone, up nearly 30% from Q2. This structural shift reflects:
- Diversification away from US dollar reserves
- Geopolitical hedging strategies
- Response to sanctions and financial system fragmentation
- Long-term store of value preferences
Central bank buying provides a consistent bid under the gold market, establishing a higher price floor than historical norms would suggest.
Exchange-Traded Fund (ETF) Inflows
Gold-backed ETFs experienced unprecedented inflows in 2025, with total annual inflows reaching $89 billion. In tonnage terms, inflows amounted to 801 metric tons, marking the highest level since 2020. North American funds primarily drove these inflows, reflecting renewed institutional and retail investor appetite for gold exposure.
Current ETF holdings are approaching the November 2020 all-time high, and analysts expect continued accumulation as the Federal Reserve maintains an accommodative stance. The Q3 2025 addition of 222 tonnes represented the biggest quarterly inflow in years.
Investment Rationale: As interest rates stabilize or potentially decline further in 2026, the opportunity cost of holding non-yielding gold diminishes, making it more attractive relative to interest-bearing alternatives. If the Fed persists in lowering rates throughout 2026, gold demand from ETF investors should increase substantially.
Physical Demand Dynamics
While jewelry demand fell 19% year-over-year to 371 tonnes in Q3 2025 due to record prices curbing consumption, the value of jewelry spending rose 13% to $41 billion, with higher prices offsetting weaker volumes. This demonstrates price inelasticity in the luxury segment.
Bar and coin demand remained robust at 316 tonnes in Q3 2025, particularly strong in key markets like India. Small bar and coin purchases have also been apparent in Europe, though some investors are taking profits at current elevated levels.
Market Sentiment Analysis
Market sentiment toward gold is overwhelmingly bullish, characterized by:
Institutional Positioning: Major investment banks and analysts maintain constructive outlooks on gold. However, speculative interest remains well below historical extremes, suggesting room for additional momentum-driven buying.
Retail Interest: Elevated prices have created mixed sentiment among retail participants, with some profit-taking evident but strong buying interest on dips.
Technical Sentiment: Despite overbought readings on momentum indicators, the persistence of fundamental drivers suggests traditional sell signals may remain ineffective for extended periods. Market structure appears stable, supported by institutional and sovereign buying rather than purely speculative positioning.
Volatility Expectations: Traders anticipate elevated volatility around the FOMC announcement, with potential for sharp moves in either direction depending on Powell's tone and the statement's content.
Comprehensive Technical Analysis
Chart Pattern Analysis
Gold is trading within a well-defined ascending channel on daily and weekly timeframes. The channel's upper boundary has been tested multiple times without breakdown, confirming the strength of the uptrend. Price action shows a series of higher highs and higher lows, the textbook definition of an uptrend.
The recent consolidation between $4,990-$5,111 represents a healthy pause after the explosive move through $5,000. This consolidation allows moving averages to catch up and provides support structure for the next leg higher.
Potential Pattern Concerns: Analysts note that a rejection at $5,100 followed by a failure to hold above $5,000 could create a double top pattern, a bearish reversal signal. This would require prices to break decisively below $4,890 to confirm, which appears unlikely in the base case scenario but remains a tail risk.
Volume and Momentum Analysis
Trading volumes surged during the breakout above $5,000, confirming strong participation and conviction. The volume profile suggests accumulation rather than distribution, with buying pressure intensifying on upswings and limited selling on pullbacks.
Momentum indicators, while overbought, continue to show expansion rather than contraction. The MACD histogram's expanding bullish bars indicate accelerating rather than decelerating momentum, though this configuration often precedes short-term exhaustion.
Elliott Wave Perspective
From an Elliott Wave perspective, gold appears to be riding an extended third wave of a five-wave cycle from the $3,997 November 18 higher low. Third waves are typically the strongest and longest in the sequence, characterized by:
- Strongest momentum
- Heaviest volume
- Most conviction
- Potential for extended targets beyond typical Fibonacci projections
If this Elliott Wave count is correct, the current movement could extend substantially higher before transitioning to a fourth wave correction. The extension to $5,111 and potential move to $5,450+ would align with third wave characteristics.
Fibonacci Analysis
Multiple Fibonacci analysis frameworks support the bullish case:
Retracement Levels: Using the November 2025 low to December 2025 high, key retracement levels provide support at:
- 23.6% retracement: ~$4,900
- 38.2% retracement: ~$4,750
- 50% retracement: ~$4,650
Extension Levels: Projecting from the same swing:
- 127.2% extension: ~$4,900 (achieved)
- 161.8% extension: ~$5,100 (current resistance)
- 200% extension: ~$5,300
- 261.8% extension: ~$5,450 (major target)
The clustering of resistance at $5,100 makes this level critical for determining the next directional move.
Scenario Analysis for January 28, 2026
Base Case Scenario (Probability: 60%)
Expected Outcome: Consolidation with upside bias, closing between $5,080-$5,140
Gold consolidates during the Asian and European sessions ahead of the FOMC announcement. Initial volatility around the 2:00 PM ET rate decision is followed by directional movement based on Powell's 2:30 PM press conference tone. If Powell strikes a balanced tone acknowledging both inflation concerns and labor market softening without signaling urgency for rate cuts, gold maintains support above $5,040 and gradually works higher toward $5,140-$5,145.
Key Characteristics:
- Limited downside probing to $5,020-$5,040 range
- Intraday volatility of 100-150 points
- Successful hold above $5,000 psychological support
- Incremental progress toward $5,145 resistance
- Volume slightly below recent average
Trading Strategy: Accumulate on dips to $5,040-$5,050 with tight stops below $4,980. Scale into positions rather than entering all at once. Target $5,145 for initial profit-taking, leaving runners for $5,172-$5,200.
Bullish Breakout Scenario (Probability: 25%)
Expected Outcome: Breakout above $5,100, rally toward $5,172-$5,200
A dovish surprise from the Fed—either through statement language hinting at earlier rate cuts than expected or Powell expressing greater concern about labor market deterioration—could trigger a powerful breakout. Additional catalysts include escalating geopolitical tensions or further dollar weakness following the announcement.
Key Characteristics:
- Strong Asian session buying lifts prices pre-FOMC
- Breakout above $5,111 with volume expansion
- Minimal pullback, momentum-driven rally
- Target achievement at $5,172, potentially extending to $5,450
- RSI reaches 85+ extreme levels
Trading Strategy: Early entry at $5,070-$5,080 ahead of FOMC if pre-announcement momentum is evident. Add on confirmed breakout above $5,111 with stops at $5,040. Scale out at $5,172, $5,200, and $5,450, leaving 25% position for extended targets.
Bearish Correction Scenario (Probability: 15%)
Expected Outcome: Profit-taking correction toward $4,890-$4,950
A hawkish Fed surprise—such as removing language about further potential cuts or Powell expressing confidence in growth and dismissing recession concerns—could trigger profit-taking in an overbought market. Technical factors alone (RSI >80, bearish divergence) could also drive a correction without fundamental catalyst.
Key Characteristics:
- Failure to hold $5,000 on FOMC announcement
- Cascade of stops triggered below $4,980
- Rapid move to test $4,890 support
- High volatility, potential 200+ point intraday range
- Retest of ascending channel lower boundary at $4,750-$4,700 possible
Trading Strategy: Avoid new longs above $5,070. If holding existing positions, tighten stops to $4,980. Prepare to buy aggressively at $4,890-$4,900 if fundamental thesis (dollar weakness, central bank buying, geopolitical tensions) remains intact. View correction as healthy consolidation opportunity rather than trend reversal.
Risk Management Considerations
Position Sizing
Given the extreme elevation in price, overbought technical indicators, and elevated volatility around major event risk (FOMC), prudent risk management is essential. Recommended position sizing adjustments include:
- Reduce standard position size by 30-40% to account for wider stop losses required in volatile environment
- Scale into positions rather than entering all at once—consider 3-4 tranches
- Risk no more than 1-1.5% of account on any single gold trade given uncertainty
- Consider options strategies such as call spreads or debit spreads to limit downside while maintaining upside exposure
Stop Loss Placement
Stop loss placement must account for intraday volatility while protecting capital:
- Conservative approach: $4,890 (below January 23 low), providing ~150-170 point room from $5,040-$5,070 entry
- Moderate approach: $4,980 (below psychological $5,000), providing ~90-110 point room
- Aggressive approach: $5,020 (tight stop for scalpers), providing 40-50 point room—only suitable for very short-term trades
Trailing Stop Strategy: Once price moves 100 points in profit, move stop to breakeven. Trail stop by $50-75 increments as trade develops, never moving stops further away once initially set.
Risk Factors to Monitor
Technical Risks:
- RSI extreme overbought (>80) increases correction risk
- Bearish RSI divergence signals potential momentum exhaustion
- Double top pattern risk if $5,100 rejection occurs
- Extended rally without meaningful consolidation increases correction magnitude
Fundamental Risks:
- Hawkish Fed surprise shifts rate cut expectations
- Unexpected strength in US economic data reduces safe-haven appeal
- Geopolitical de-escalation reduces risk premium
- Dollar strength if intervention concerns ease
- Large liquidations from profit-taking at psychological levels
Event Risks:
- FOMC statement language more hawkish than expected
- Powell press conference contains surprises or policy shifts
- Unexpected economic data releases before market open
- Flash crashes or liquidity gaps around announcement times
Trading Plan for January 28, 2026
Pre-Market Preparation (Before 9:30 AM ET)
- Review overnight price action: Assess Asian and early European session direction and volume
- Check news headlines: Scan for overnight geopolitical developments or economic data
- Identify key levels: Mark $5,040, $5,000, $4,980, $4,890 support and $5,100, $5,145, $5,172 resistance
- Set alerts: Configure alerts at $5,100 (breakout), $5,000 (psychological), $4,980 (breakdown)
- Prepare orders: Stage entry orders at $5,040-$5,050 with stops at chosen levels
Morning Session Strategy (9:30 AM - 2:00 PM ET)
Objective: Accumulate positions on dips while awaiting FOMC announcement
- Watch for consolidation: Expect range-bound trading as markets await Fed decision
- Entry zone: Look for dips to $5,040-$5,070 range for initial position (25-33% of planned size)
- Avoid chasing: Do not chase prices above $5,090 before FOMC
- Risk management: Place stops immediately upon entry, never enter without stops
- Monitor correlations: Watch USD index, Treasury yields, and S&P 500 for clues about risk sentiment
FOMC Announcement Strategy (2:00 PM ET)
High Volatility Period - Exercise Caution
- Rate decision release: Expect 50-100 point immediate move on statement
- Read statement quickly: Assess hawkish/dovish tone in forward guidance
- Wait for clarity: Avoid impulsive trades in first 2-3 minutes of extreme volatility
- Scale in carefully: If base case unfolds (hold above $5,000), add to positions at $5,050-$5,070
- Emergency stops: Widen stops by 20-30 points during announcement to avoid stop-hunting, then tighten immediately after
Powell Press Conference Strategy (2:30 PM - 3:15 PM ET)
Directional Clarity Emerges
- Monitor Powell's tone: Assess confidence level, concern about inflation vs. growth
- Q&A critical: Often more market-moving than prepared remarks
- Trend confirmation: By 2:45 PM, directional trend should be established
- Add to winners: If position is profitable and Powell tone supports thesis, add final tranche
- Cut losers: If position is underwater and Powell contradicts thesis, exit rather than hoping for reversal
Late Session Strategy (3:15 PM - 4:00 PM ET)
Position Management and Profit-Taking
- Assess daily candle: Determine if close will be strong/weak relative to range
- Partial profits: Take 30-50% profits at $5,145 if reached, more at $5,172
- Overnight holds: Only hold substantial positions overnight if close is strong (upper 25% of range) and fundamental thesis intact
- Weekend adjustment: Consider closing 50-75% of position before weekend if holding overnight
- Review and journal: Document trade execution, emotional state, and lessons learned
Multi-Timeframe Analysis
Daily Timeframe
The daily chart shows a powerful uptrend with price trading well above all moving averages. Each pullback has been shallow and brief, quickly followed by renewed buying pressure. The ascending channel remains intact, with price currently in the upper portion of the channel.
Daily candlestick patterns show predominantly bullish candles with small wicks, indicating strong conviction. The most recent daily candles show some upper wicks and doji-like patterns, suggesting indecision at current levels ahead of the FOMC.
Daily Outlook: Bullish structure intact. Watch for daily close above $5,100 to confirm continuation, or close below $5,000 to signal correction risk.
4-Hour Timeframe
The 4-hour chart reveals the consolidation pattern following the $5,111 high. Price is forming a bull flag or pennant pattern, a continuation pattern that typically resolves in the direction of the prior trend (upward).
The 20-period exponential moving average on 4-hour charts sits near $5,039, providing dynamic support. As long as 4-hour closes remain above this level, the bullish structure persists.
4-Hour Outlook: Consolidation near highs. Breakout above $5,100 on 4-hour close signals continuation; breakdown below $5,020 signals correction.
1-Hour Timeframe
The 1-hour chart shows tight consolidation between $5,040-$5,090 ahead of the FOMC. This coiling action often precedes explosive moves, though direction remains uncertain until catalyst emerges.
Volume has decreased during consolidation, typical ahead of major announcements. The 1-hour chart will be critical for identifying the initial direction post-FOMC and confirming follow-through.
1-Hour Outlook: Range-bound pre-FOMC. Initial breakout direction likely determines remainder of session. Watch for false breakouts in first 2-3 minutes after announcement.
15-Minute Timeframe
The 15-minute chart is useful for precise entry and exit timing but prone to noise. During normal sessions, 15-minute trends provide scalping opportunities. However, around FOMC announcements, 15-minute charts become erratic and should not drive decision-making.
15-Minute Outlook: Utilize for fine-tuning entries and exits during non-volatile periods. Ignore during FOMC volatility spike.
Correlation Analysis
USD/Gold Inverse Relationship
The US Dollar Index (DXY) and gold maintain their traditional inverse correlation. With DXY weakening to 97.07 and showing downside momentum, gold receives substantial support from this relationship.
Key Level for DXY: Watch 97.00 on DXY. A break below this level likely propels gold toward $5,172+. Conversely, a bounce in DXY above 98.00 could pressure gold back toward $5,000.
Gold vs. Treasury Yields
The 10-year Treasury yield sits at approximately 4.211%, with the 2-year at 3.588%. Real yields (nominal yields minus inflation expectations) remain the critical driver for gold.
With inflation running near 2.9% (core PCE), real yields are only modestly positive. If inflation expectations rise or nominal yields fall, real yields compress, benefiting gold substantially.
Gold vs. Risk Assets
Gold's behavior has decoupled somewhat from traditional risk-on/risk-off dynamics. While equity markets have remained resilient, gold continues to rally, suggesting multiple drivers beyond pure safe-haven flows.
This decoupling indicates structural demand (central banks, ETFs) is dominating over tactical flows (risk sentiment), a bullish development suggesting staying power in the rally.
Seasonality Considerations
January and February typically show mixed seasonal patterns for gold, with no strong historical bias. However, 2026's unique setup—record highs, strong momentum, and major catalysts—diminishes the relevance of historical seasonal patterns.
Early-year positioning by institutional investors for annual portfolios can create buying pressure in January-February, particularly if the previous year showed strong performance (as 2025 did for gold).
Alternative Scenarios and Black Swan Events
While base, bullish, and bearish scenarios cover most probable outcomes, traders should remain aware of low-probability, high-impact events:
Flash Crash Risk: In thin liquidity around FOMC, algorithmic trading or fat-finger errors can create brief but severe price dislocations. Always use stop losses but place them at technically significant levels to avoid stop-hunting.
Coordinated Intervention: If G7 nations announce coordinated currency interventions (particularly USD/JPY), gold could see violent moves in either direction depending on implementation details.
Emergency Policy Action: Any surprise emergency rate cut or unexpected policy tool deployment would likely send gold sharply higher as confidence in fiat currencies erodes.
Geopolitical Shock: Escalation in major conflicts (Middle East, Eastern Europe, Asia-Pacific) could trigger safe-haven surges pushing gold to $5,450+ within hours.
Professional Tips for Trading the FOMC Event
- Reduce Position Size: Never hold full position through major event risk. Scale down to 25-50% of normal size.
- Use Wide Stops: Temporarily widen stops by 50% during announcement to avoid stop-hunting, then tighten once volatility settles.
- Avoid Market Orders: Use limit orders exclusively during volatile periods to control execution prices.
- Have Exit Plan: Know exact price levels where you will exit for both profit and loss before event occurs.
- Don't Revenge Trade: If initial move stops you out, wait at least 30 minutes before re-entering to avoid emotional trading.
- Monitor Multiple Timeframes: Don't fixate on one timeframe. Confirm moves across 1-hour, 4-hour, and daily charts.
- Read Market Structure: Price action around key levels (does it bounce strongly or linger?) reveals true market sentiment.
- Stay Flexible: Be willing to reverse bias if evidence contradicts thesis. Stubbornness destroys accounts.
- Journal Everything: Document entries, exits, reasoning, and emotions for post-trade review and continuous improvement.
- Preserve Capital: Your primary job is protecting capital, not catching every move. Missing a trade is better than forcing a bad trade.
Conclusion and Final Recommendation
XAU/USD stands at a historic juncture, having broken above $5,000 for the first time and consolidating near all-time highs. The technical structure remains bullish with price trading within an ascending channel, supported by strong fundamentals including central bank buying, record ETF inflows, dollar weakness, and persistent geopolitical tensions.
However, overbought technical indicators (RSI >80) and elevated volatility around the January 28 FOMC meeting demand cautious position management. The Federal Reserve is expected to hold rates steady at 3.5%-3.75%, but Jerome Powell's tone and forward guidance will determine gold's next directional move.
Final Signal for January 28, 2026: CAUTIOUSLY BULLISH
Recommended Strategy:
- Enter long positions on dips to $5,040-$5,070 with 30-40% reduced position size
- Place stops below $4,980 (aggressive) or $4,890 (conservative)
- Target $5,145 (first), $5,172 (second), $5,450 (extended)
- Take partial profits at each target level
- Trail stops as position moves into profit
- Avoid holding full size through FOMC announcement
- Be prepared to exit quickly if price closes decisively below $5,000
The preponderance of evidence supports higher gold prices over the coming weeks and months, but the path higher will likely include volatility and periodic corrections. Traders should prioritize risk management over profit maximization, recognizing that extreme overbought conditions can persist longer than expected in strong trending markets but eventually lead to sharp corrections.
The convergence of structural demand shifts (central banks), tactical positioning (ETFs), technical momentum, and fundamental drivers creates a rare alignment favoring gold. However, trading at all-time highs requires exceptional discipline—letting winners run while cutting losers quickly, and never averaging down on losing positions.
For January 28, 2026 specifically, the FOMC meeting represents both opportunity and risk. Traders with appropriate risk management can capitalize on directional moves following the announcement, while those overleveraged or undisciplined face substantial risk. The key is positioning conservatively ahead of the event, then adding to winners if the base case unfolds.
Gold's long-term trajectory appears biased higher, but short-term volatility will test the resolve and discipline of every trader. Success will come to those who combine sound technical analysis, fundamental awareness, and rigorous risk management—the three pillars of professional trading.
Remember: No analysis, however comprehensive, eliminates risk. Markets can and do behave irrationally around major events. Protect your capital first, pursue profits second, and never risk more than you can afford to lose. This analysis represents educational information and probability assessment, not a guarantee of outcomes. Trade responsibly and in accordance with your individual risk tolerance and financial situation.
Comments ()