XAU/USD Trading Signal and Deep Market Analysis for January 29, 2026
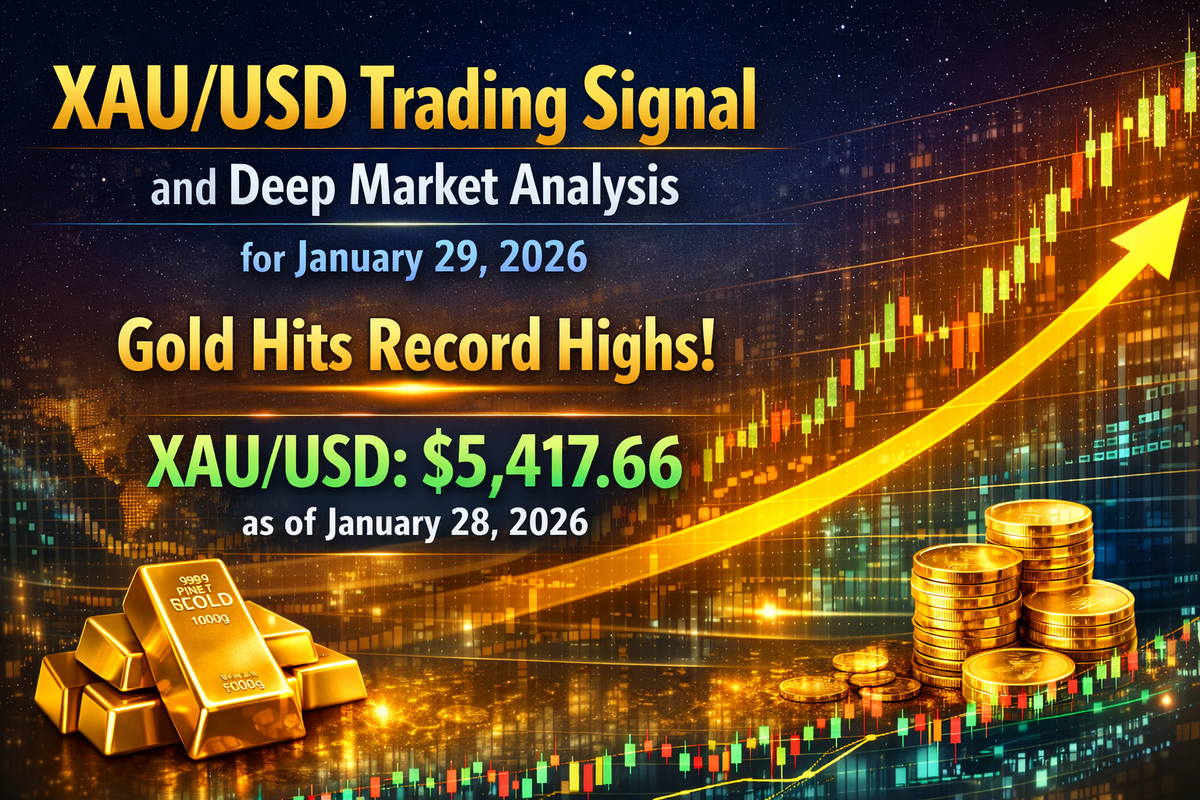
Gold has reached unprecedented heights in the global financial markets, with XAU/USD trading at $5,417.66 as of January 28, 2026. The precious metal continues its remarkable ascent, driven by a confluence of geopolitical tensions, monetary policy dynamics, and safe-haven demand that has propelled prices beyond the psychological $5,000 barrier for the first time in history.
Trading Signal for January 29, 2026
Primary Signal: BUY on Dips
Entry Points:
- Aggressive Entry: Buy at market price ($5,400-$5,420 range)
- Conservative Entry: Buy on pullback to $4,940-$5,040 support zone
Profit Targets:
- Target 1: $5,320.89 (short-term)
- Target 2: $5,405-$5,426 (medium-term)
- Target 3: $5,545-$5,608 (extended target)
Stop Loss:
- For long positions from current levels: $5,237.40
- For long positions from $4,940 level: $4,900
Risk-Reward Ratio: Approximately 1:2.5 to 1:3
Signal Confidence Level: High (75-80%)
The bullish bias remains dominant, though traders should anticipate short-term volatility around key resistance levels and potential profit-taking corrections.
Current Market Status and Price Action
Gold's meteoric rise represents one of the most significant precious metals rallies in modern financial history. The metal surged 64% throughout 2025 and has already gained 18% year-to-date in 2026. This performance reflects fundamental shifts in global risk perception, monetary policy expectations, and the erosion of confidence in traditional reserve currencies.
Trading within a well-defined ascending channel since late December, XAU/USD has consistently found buyers at higher lows while breaking through successive resistance barriers. The current price structure demonstrates characteristics of a mature uptrend, with increasing participation from both institutional and retail investors.
Technical Analysis: Multi-Indicator Confirmation
Moving Averages and Trend Indicators
The technical foundation for gold's bullish trajectory remains exceptionally strong. Moving averages across multiple timeframes provide unambiguous confirmation of the prevailing uptrend. The Exponential Moving Average (EMA-85) sits well below current market prices, with gold maintaining consistent distance from this dynamic support level.
The 20-period Simple Moving Average (SMA20) and Volume Weighted Average Price (VWAP) both remain positioned beneath market prices, suggesting continuation of bullish momentum. This configuration typically signals that the path of least resistance continues to favor upside movement, particularly when combined with increasing volume on upward price swings.
Oscillator Analysis
Relative Strength Index (RSI): The RSI currently registers near 77 on the 4-hour chart, firmly in overbought territory. While this suggests the potential for near-term consolidation or minor corrections, overbought conditions in strong uptrends can persist longer than traditional interpretations suggest. Historical analysis of gold's behavior during sustained rallies indicates that RSI readings above 70 can continue for extended periods when fundamental drivers remain supportive.
A critical technical signal to monitor is the potential rebound from the bullish trend line on the RSI indicator, which would provide confirmation for continuation of the upward trend following any corrective pullback.
Moving Average Convergence Divergence (MACD): The MACD indicator shows strong positive momentum, with the histogram rising in positive territory and the signal line maintaining upward trajectory. This configuration confirms active bullish momentum and suggests that the current impulse wave has not yet exhausted itself. The MACD's behavior during recent consolidation phases has demonstrated resilience, with the indicator quickly recovering momentum after brief pauses.
Money Flow Index (MFI): The MFI presents a more cautious signal, showing declining readings that indicate an outflow of liquidity. This divergence between price action and money flow warrants attention, as it can presage short-term corrections when investors lock in profits following substantial gains. However, in the context of strong fundamental drivers, MFI weakness often represents temporary consolidation rather than trend reversal.
Chart Patterns and Price Structure
The identification of a "Three White Soldiers" pattern within the $5,107.72 to $5,266.41 range provides strong confirmation of strengthening bullish momentum. This Japanese candlestick pattern, characterized by three consecutive long-bodied bullish candles with progressively higher closes, typically signals the continuation or acceleration of an uptrend, particularly when it appears after a period of consolidation.
Gold continues to respect an ascending channel structure that has guided price action since late December. The upper boundary of this channel currently resides near $5,405-$5,420, while the lower boundary provides dynamic support around $5,190-$5,215. Traders should monitor price behavior at the channel extremes, as rebounds from the lower boundary offer favorable risk-reward entry opportunities, while approaches to the upper boundary may trigger profit-taking.
Support and Resistance Levels
Critical Support Zones:
- Immediate Support: $5,208.41 - First line of defense for bullish structure
- Secondary Support: $5,153.72 - Break below would signal deeper correction
- Major Support: $5,040-$5,052.87 - Key psychological and technical level
- Strong Support: $4,940-$4,996.26 - High-probability reversal zone
- Critical Support: $4,900 - Break would invalidate near-term bullish outlook
Key Resistance Levels:
- Immediate Resistance: $5,266.41 - Current test zone
- Secondary Resistance: $5,320.89 - Breakout target for continuation
- Major Resistance: $5,370.11-$5,405 - Channel upper boundary
- Extended Targets: $5,426.67, $5,490.37, $5,545, $5,608.39
The depth and number of support levels below current market prices provide substantial downside cushioning, suggesting that any corrections are likely to find willing buyers at multiple price points.
Fundamental Analysis: Drivers of Gold's Rally
Federal Reserve Policy and Interest Rate Dynamics
The Federal Reserve's decision on January 28, 2026, to maintain the federal funds rate at 3.5-3.75% met market expectations but carried significant implications for gold markets. The FOMC statement acknowledged that "economic activity has been expanding at a solid pace" while noting that "inflation remains somewhat elevated" and "uncertainty about the economic outlook remains elevated".
Chairman Jerome Powell's subsequent press conference reinforced the committee's cautious stance, emphasizing data-dependent decision-making and attentiveness to dual mandate risks. The Fed's decision not to implement further rate cuts, despite completing three consecutive reductions in the latter half of 2025, reflects concerns about persistent inflation and the potential inflationary impact of newly implemented tariff policies.
According to CME Group data, market participants assign only a 2.8% probability to an interest rate cut to 3.25-3.50% in the near term, with 97.2% expecting rates to remain unchanged at upcoming meetings. This rate environment creates a complex dynamic for gold. While elevated real yields traditionally exert downward pressure on non-yielding assets like gold, the current macro regime demonstrates that traditional correlations have weakened considerably.
The persistent strength in gold prices despite firm interest rates signals that markets are pricing a structural risk premium tied to deeper macroeconomic trends rather than responding primarily to yield differentials. Policy credibility reassessments across multiple regions, stretching fiscal trajectories, and fragmenting geopolitical blocs contribute to an environment where macroeconomic stability cannot be taken for granted.
US Dollar Dynamics and Currency Markets
Gold's rally has coincided with notable weakness in the US dollar, breaking the traditional inverse correlation that has historically governed the relationship between these two assets. The dollar index has declined amid multiple pressures, including expectations of reduced Federal Reserve hawkishness, concerns about US fiscal sustainability, and erosion of confidence in dollar hegemony driven by aggressive unilateral trade policies.
The relationship between gold prices and the US dollar centers on fundamental economics: gold is priced globally in dollars, so dollar strength typically increases gold's cost in other currencies, reducing international demand and applying downward price pressure. Conversely, dollar weakness makes gold relatively cheaper for holders of other currencies, boosting demand and lifting prices.
However, the current market environment reveals a significant evolution in this relationship. Gold is holding near recent highs even as the dollar maintains relative firmness in certain markets, signaling that investors increasingly prioritize structural risk considerations over short-term currency fluctuations. The shift reflects concerns regarding international geopolitical tensions and questions about long-term reserve currency stability.
Japanese yen strength has contributed to broader dollar weakness, with currency markets on high alert for potential intervention. Traders have reduced dollar holdings ahead of major policy announcements, further pressuring the greenback and providing additional support for dollar-denominated commodities like gold.
Geopolitical Risk Premium and Safe-Haven Demand
President Donald Trump's trade policies have emerged as a primary driver of gold's safe-haven bid. The administration has implemented or threatened tariffs on a broad array of trading partners, creating unprecedented uncertainty in global commerce. On January 19, 2026, Trump announced a 10% tariff on imports from Denmark, Sweden, France, the United Kingdom, the Netherlands, and Finland, set to take effect on February 1, with the possibility of increases to 25% until agreements regarding Greenland are finalized.
More dramatically, Trump has threatened 100% tariffs on Canadian goods, strengthening trade connections with China, and warned of 200% tariffs on French wines and champagnes in apparent efforts to pressure European leaders on various geopolitical issues. The European Union has responded by contemplating a €93 billion tariff package on US goods in retaliation, raising the specter of a comprehensive transatlantic trade war.
Research demonstrates that tariff incidents exert profound short-term impacts on financial markets, with negative effects on equity markets and positive effects on gold markets. The current tariff environment represents what analysts have described as "the most disruptive trade war since the 1930s," disrupting supply chains and escalating business expenses across multiple industries and geographies.
Beyond trade policy, geopolitical tensions extend to multiple flashpoints. Trump has warned Iran against further aggression if it resumes its nuclear program and announced US strikes on infrastructure in Venezuela, while escalating rhetoric around Greenland's strategic importance has strained relationships with traditional allies. The probability of a peaceful resolution to the Russia-Ukraine conflict has declined after Moscow suggested revising its negotiating position, sustaining elevated risk premiums in commodity markets.
This constellation of geopolitical pressures supports gold through multiple channels. Direct safe-haven demand increases as investors seek stores of value during periods of elevated uncertainty. Additionally, geopolitical fragmentation accelerates the trend toward a multipolar world order, encouraging central banks to diversify reserve holdings away from traditional dollar-denominated assets.
Central Bank Accumulation and Official Sector Demand
Central bank gold purchases represent a critical structural support for prices. China's central bank completed its 14th consecutive month of gold buying in December 2025, exemplifying the persistent official sector demand that has characterized recent years. Surveys indicate unprecedented high demand for gold from central banks globally, with Goldman Sachs expecting monthly buying to average approximately 60 metric tons throughout 2026.
Forecasts suggest that national bank gold purchases may reach an average of 70 tons per month during 2026, providing consistent buying pressure that supports price floors during potential corrections. This demand reflects strategic considerations beyond simple portfolio diversification. Central banks in emerging markets and commodity-exporting nations seek to reduce exposure to dollar-denominated reserves amid concerns about weaponization of the financial system through sanctions regimes and unilateral policy actions.
The official sector's buying behavior demonstrates particular resilience, continuing through price advances that might otherwise trigger profit-taking. This price-insensitive demand creates an asymmetric dynamic in gold markets, where selling pressure during corrections tends to be absorbed more quickly than in previous cycles.
Exchange-Traded Fund Inflows and Retail Participation
Gold and precious metals commodity funds attracted $1.96 billion in net inflows during the week ending January 21, 2026, marking the tenth week of net purchases in the past eleven weeks. This sustained inflow represents a dramatic shift from previous periods when investor positioning in gold-backed ETFs remained subdued despite rising prices.
In the fourth quarter of 2025 alone, retail-focused ETFs experienced inflows equivalent to over 280 tonnes in purchases, eclipsing central bank demand during that period. Record inflows into exchange-traded funds have provided additional fuel for gold's rally, with rising inflows expected to continue lending support amid expectations of potential future US rate cuts.
The participation of retail investors through accessible ETF structures democratizes gold investment and creates momentum dynamics that can amplify price movements in both directions. Current positioning suggests strong conviction among a broad base of investors, though elevated inflows also raise questions about potential vulnerability to sentiment shifts that could trigger rapid outflows.
Inflation Expectations and Real Yield Considerations
Despite the Federal Reserve's maintenance of relatively elevated interest rates, inflation concerns persist and support gold's appeal as an inflation hedge. Real yields—the difference between nominal interest rates and inflation expectations—remain positive but compressed compared to historical averages. Traditional analysis suggests this environment should constrain gold prices, yet the metal's resilience indicates that other factors have superseded yield considerations in investor decision-making.
Financial conditions remain tighter than during ultra-loose monetary policy cycles of recent decades, yet this has not produced the sustained downward pressure on gold that conventional frameworks would predict. The disconnect suggests that markets are forward-looking, anticipating potential inflation acceleration from tariff-induced cost pressures, fiscal expansion, and supply chain disruptions associated with deglobalization trends.
Economic Calendar Events for January 29, 2026
The economic calendar for January 29, 2026, features limited high-impact releases, with the primary data point being Initial Jobless Claims from the United States. This weekly indicator provides insights into labor market health and can influence expectations for Federal Reserve policy trajectory.
Strong labor market data, evidenced by lower-than-expected jobless claims, would reinforce the Fed's case for maintaining current interest rate levels and could theoretically pressure gold through expectations of prolonged higher rates. However, given the current market regime where geopolitical factors dominate gold price action, the impact of economic data has been muted relative to developments in trade policy and international tensions.
Conversely, weaker labor market indicators could revive speculation about potential rate cuts later in 2026, providing additional support for gold prices. The market's reaction function has shifted toward interpreting economic weakness as justification for easier monetary policy rather than as a negative for gold through reduced investment demand.
Beyond scheduled data releases, markets will remain sensitive to any announcements or comments from President Trump regarding tariff policies, as these have demonstrated capacity to generate immediate and substantial market movements.
Professional Forecasts and Price Targets
Major financial institutions and independent analysts have issued notably bullish forecasts for gold's trajectory through 2026 and beyond. Goldman Sachs projects gold reaching $5,400 per ounce by year-end 2026, representing modest upside from current levels but substantial appreciation from where prices stood at the beginning of the year. Deutsche Bank has issued an even more optimistic forecast, suggesting $6,000 per ounce is possible, citing persistent geopolitical tensions, central bank buying, and structural shifts in the international monetary system.
Philip Newman, director at Metals Focus, stated: "We foresee further growth for gold. Our current projections indicate prices could peak around $5,500 later this year". He added that "temporary pullbacks may occur as investors lock in profits, but we anticipate these corrections will be brief and met with strong buying interest".
Technical analysts at Forex24 identify a potential target above $5,545 following any corrective move toward the $4,675 support level, suggesting substantial upside remains even after accounting for near-term consolidation. This forecast aligns with the ascending channel structure that has guided gold's rally, projecting the upper boundary forward in time.
More conservative forecasts acknowledge the possibility of stabilization, with some analysts suggesting prices could moderate to $4,786.85 by late January if anticipated interest rate pressures materialize more strongly than currently expected. However, the consensus among professional forecasters tilts decisively bullish, reflecting recognition that the fundamental drivers supporting gold remain firmly in place.
Longer-term projections extend even higher, with some forecasts placing XAU/USD at $14,838 by the end of 2026 and $24,659 by 2030, representing dramatic appreciation scenarios predicated on continued monetary debasement and geopolitical fragmentation. While such extreme targets incorporate highly speculative assumptions, they illustrate the range of possibilities under scenarios where current trends accelerate.
Risk Factors and Bearish Scenarios
Despite the predominantly bullish outlook, traders must remain cognizant of factors that could trigger corrections or reversals in gold's upward trajectory. The most immediate technical risk stems from extreme overbought conditions across multiple timeframes. RSI readings near 77 on 4-hour charts and declining Money Flow Index readings suggest that the market has absorbed substantial buying pressure and may require consolidation before resuming advances.
A decisive break below the $4,425 level would invalidate the ascending channel structure and suggest a more significant correction toward $3,815. While this scenario appears unlikely given current fundamental support, technical breakdowns can occur rapidly when leveraged positions unwind during periods of reduced liquidity.
Fundamental risks include potential de-escalation of geopolitical tensions, which could reduce safe-haven demand and trigger profit-taking. A hypothetical breakthrough in US-China trade negotiations, resolution of conflicts in Ukraine or the Middle East, or scaling back of aggressive tariff policies could each prompt reassessment of gold's risk premium.
Strengthening of the US dollar driven by robust economic data or unexpected hawkish shifts in Federal Reserve policy would apply traditional downward pressure on gold prices. While the correlation between dollar strength and gold weakness has weakened recently, it has not disappeared entirely, and a sustained dollar rally could challenge gold's ascent.
Regulatory changes or legal challenges to tariff policies could also impact market dynamics. The Supreme Court's review of the International Emergency Economic Powers Act (IEEPA) and its application to tariffs carries implications for gold markets. If tariffs are overturned or scaled back through legal channels, gold may experience short-term pullbacks as uncertainty fades and risk appetite returns to other asset classes.
Finally, technical analysts warn that the extended nature of gold's rally increases vulnerability to cascading stop-loss orders during any sharp reversal. Large speculative positions accumulated during the advance could unwind rapidly if key support levels fail, creating temporary but severe downside volatility.
Trading Strategies and Risk Management
Successful navigation of the current gold market environment requires balancing recognition of the strong bullish trend with prudent risk management that accounts for elevated volatility and overbought technical conditions.
Position Sizing and Entry Tactics
Given the strength of the prevailing trend, the primary strategy should focus on buying pullbacks rather than attempting to short against momentum. Aggressive traders comfortable with current price levels can establish long positions near $5,400-$5,420, using tight stops below $5,237.40 to limit downside risk.
Conservative traders should exercise patience, waiting for corrections toward the $4,940-$5,040 support zone to establish positions with more favorable risk-reward profiles. Historical price action demonstrates that gold has consistently attracted buyers at higher lows within the ascending channel, making dip-buying an effective approach.
Position sizing should reflect the elevated volatility inherent in precious metals markets during periods of rapid price appreciation. Limiting individual trade risk to 1-2% of trading capital provides sufficient cushion to withstand normal intraday fluctuations while maintaining exposure to the broader trend.
Stop Loss Placement and Trade Management
Stop losses should be positioned below clearly defined technical levels rather than at arbitrary percentage distances from entry prices. For positions entered at current levels near $5,400, stops below $5,237.40 protect against breaks of the ascending channel's lower boundary. For entries near $4,940, stops below $4,900 provide appropriate protection.
As trades move in the intended direction, implementing trailing stops that respect the channel structure allows profits to run while protecting against reversals. Moving stops to breakeven once the first profit target is achieved eliminates risk while maintaining exposure to further upside.
Profit Taking and Target Selection
The identified profit targets at $5,320.89, $5,405-$5,426, and $5,545-$5,608 provide logical points to take partial profits. Scaling out of positions at successive targets rather than exiting entirely allows participation in extended moves while securing gains incrementally.
Traders should monitor price behavior at resistance levels carefully. Aggressive profit-taking ahead of major round numbers and channel boundaries often creates temporary reversals that offer opportunities to re-enter at better prices.
Alternative Scenarios
While the base case anticipates continued gains, traders must prepare for alternative scenarios. A break and close below $5,190 would suggest the ascending channel has failed and could trigger more substantial declines toward $5,105. In such circumstances, existing long positions should be exited or significantly reduced, with consideration given to tactical short positions targeting the $4,800-$4,900 zone.
Conversely, a decisive breakout above $5,266.41 on increasing volume would confirm continuation of the bullish impulse and justify adding to existing positions with targets extended to $5,490.37 and higher.
Comparative Analysis: Gold vs. Silver Performance
Gold's rally has been accompanied by even more dramatic gains in silver, which surpassed the $100 barrier for the first time in history and subsequently climbed to new all-time highs above $109. Silver recorded weekly gains of 13% and year-to-date gains of 43%, with twelve-month returns exceeding 200%.
The gold-to-silver ratio has declined to a 14-year low, reflecting silver's superior performance driven by its dual nature as both an investment and industrial metal. This gives silver a powerful boost from factors supporting investment demand for gold while benefiting from ongoing industrial applications in technology, renewable energy, and manufacturing sectors.
The outperformance of silver relative to gold often characterizes mature stages of precious metals bull markets, when investor risk appetite increases and speculative interest shifts toward more volatile assets with greater leverage to the underlying trend. However, silver's industrial component also exposes it to economic cycle risks that could trigger sharper corrections if growth concerns intensify.
Conclusion and Tomorrow's Trading Plan
The technical and fundamental analysis converges on a constructive outlook for XAU/USD on January 29, 2026, though traders should anticipate heightened volatility and the potential for corrective pullbacks within the broader uptrend. The combination of geopolitical tensions, central bank buying, ETF inflows, and dollar weakness creates a supportive environment for continued gold appreciation.
The primary trading signal remains BUY, with preference for establishing or adding to long positions on any intraday weakness toward the $5,153-$5,208 support zone. Aggressive traders can maintain exposure at current levels, recognizing that overbought conditions may limit immediate upside but do not negate the medium-term bullish case.
Key levels to monitor include resistance at $5,266.41 and $5,320.89, breaks above which would confirm continuation toward extended targets near $5,405-$5,545. Support at $5,208.41 and $5,153.72 must hold to maintain constructive technical structure.
The economic calendar offers limited high-impact events, with Initial Jobless Claims data unlikely to substantially alter gold's trajectory unless results dramatically exceed or fall short of expectations. Greater market-moving potential exists in unscheduled developments related to tariff policies or geopolitical tensions, which continue to dominate gold's price action.
Risk management remains paramount given the extended nature of the rally and elevated technical indicators. Traders should employ appropriate position sizing, well-defined stop losses, and systematic profit-taking strategies to navigate this environment successfully. The overriding principle remains to align positions with the prevailing trend while respecting the potential for sharp but temporary corrections that characterize precious metals markets during periods of heightened volatility.
For January 29, 2026, the bias is clearly bullish, with expectations for continued upward pressure that may pause at resistance levels but is likely to resume given the strength of underlying fundamental drivers. Gold's transformation from a traditional inflation hedge into a comprehensive safe-haven asset reflecting concerns about geopolitical fragmentation and monetary system stability suggests that the structural bull market has further to run, making pullbacks attractive buying opportunities for position traders and longer-term investors.
Comments ()