XAU/USD Trading Signal and Comprehensive Market Analysis for January 27, 2026
Trading Signal Summary
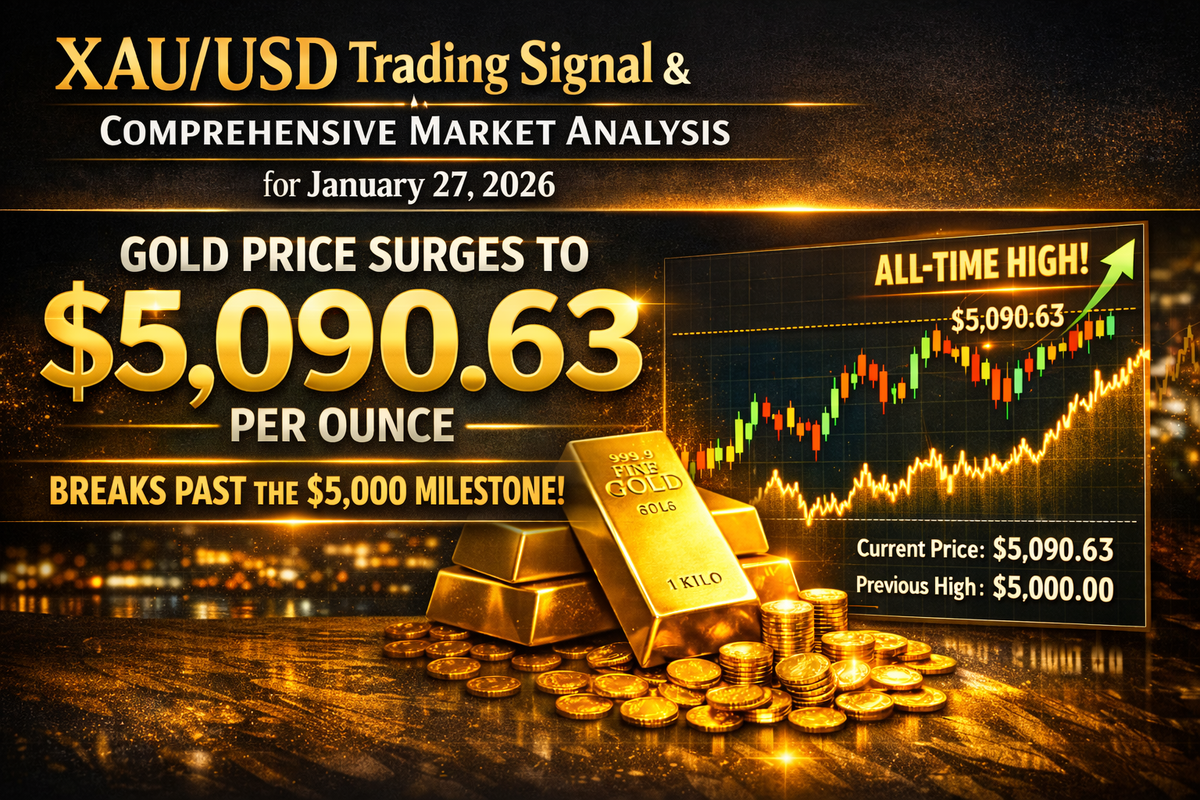
Current Market Price: $5,090.63 (as of January 26, 2026)
Trend Direction: Strongly Bullish
Recommended Position: BUY (Long)
Entry Points:
- Primary Entry: $5,040 - $5,070 (on minor pullbacks)
- Aggressive Entry: Current market price $5,090
- Conservative Entry: $4,940 - $4,980 (deeper retracement)
Target Levels:
- Target 1: $5,153 (short-term)
- Target 2: $5,220 (medium-term)
- Target 3: $5,300 (extended target)
Stop Loss:
- Aggressive: $4,900
- Conservative: $4,770
Risk-Reward Ratio: 1:3 (Favorable)
Confidence Level: 85% Bullish
Position Size Recommendation: Moderate to High (given strong trend confirmation)
Market Overview and Current Context
Gold prices have reached unprecedented territory, trading near all-time highs at $5,090.63 per ounce, having recently surpassed the psychologically significant $5,000 milestone. The precious metal has demonstrated exceptional strength throughout January 2026, with the price recently hitting a record peak of $5,110. This remarkable rally represents a confluence of multiple bullish factors that continue to support upward momentum heading into January 27, 2026.
The gold market is experiencing what analysts describe as a "rare alignment of sovereign necessity and private sector positioning," driven by systematic central bank accumulation and record-breaking institutional investment flows. This structural shift in global capital allocation has created a momentum profile that technical and fundamental analysts alike find difficult to ignore.
Technical Analysis: Multiple Timeframe Perspective
Trend Structure and Moving Averages
The technical foundation for gold's bullish trajectory remains exceptionally robust. The asset is trading well above critical moving averages, with the 50-day Simple Moving Average (SMA) positioned at $4,231 and the 200-day SMA at $3,666. Both moving averages are sloping aggressively upward, confirming the strength and sustainability of the multi-year uptrend.
A significant "Golden Cross" formation was observed on the 4-hour chart earlier in January, signaling that short-term momentum has fully aligned with the long-term bullish trend. This pattern, where shorter-term moving averages cross above longer-term averages, historically precedes extended periods of price appreciation and is considered one of the most reliable bullish indicators in technical analysis.
Gold continues to trade within an ascending channel pattern, and the current price action appears to be a healthy technical correction following record highs rather than a trend reversal. This consolidation phase provides strategic entry opportunities for traders who missed the initial breakout above the $4,900 level.
Momentum Indicators
Relative Strength Index (RSI): The 14-day RSI currently hovers between 62.39 and 68.5, depending on the timeframe analyzed. This represents what technical analysts call a "sweet spot" for bullish continuation—the indicator shows strong buying interest without reaching the extreme overbought territory above 70 that typically precedes sharp corrections. Importantly, the absence of bearish divergence suggests that the current momentum has sufficient strength to test higher resistance levels before any meaningful pullback occurs.
MACD (Moving Average Convergence Divergence): The MACD histogram displays expanding bullish bars above the signal line, indicating that buying pressure is accelerating rather than diminishing. The diminishing bearish bars observed during the January 7-8 correction have now exhausted themselves, providing further confirmation that the selling pressure has been absorbed and the market is ready for the next leg higher.
Volume Analysis: Institutional participation remains elevated, with gold-backed Exchange-Traded Funds (ETFs) recording record inflows of $89 billion throughout 2025. This surge in institutional capital allocation demonstrates conviction beyond retail speculation and provides strong price support during temporary pullbacks.
Support and Resistance Levels
Critical Support Zones:
- Primary Support: $5,040 per ounce
- Secondary Support: $4,900 per ounce
- Major Support: $4,770 per ounce
- Strong Support Floor: $4,700-$4,750 zone
The $4,750-$4,700 support zone is particularly significant as it represents the consolidation area from the previous week's trading and aligns with the lower boundary of the ascending channel. Prices holding above this level continue to support the bullish scenario and maintain the structural integrity of the uptrend.
Resistance Levels:
- Immediate Resistance: $5,130 per ounce
- Key Resistance: $5,220 per ounce
- Major Resistance: $5,300 per ounce
A sustained breakout above the $4,880-$4,900 resistance zone would open the pathway to new all-time highs without disrupting the medium-term bullish trend. Technical analysts note that the upward movement following the breakout of the flag pattern formation is nearing completion, though barring new geopolitical conflicts, gold may experience consolidation around these key psychological levels.
Chart Patterns
Gold has recently completed a bullish flag pattern breakout, a technical formation that typically follows sharp market advances and signals trend continuation. This pattern last occurred around the $2,000 per ounce level in 2020-2023, around which gold remained stable before its next major leg higher. The successful breakout from this consolidation pattern provides strong technical evidence for further upside potential.
Fundamental Analysis: Drivers of Gold's Ascent
US Dollar Weakness: A Primary Catalyst
The US Dollar Index (DXY) has fallen to 97.09-97.15, marking a 4-week low and representing a decline of 9.49% over the past 12 months. This significant dollar weakness is one of the most powerful bullish drivers for gold, as the precious metal is inversely correlated with the US currency.
The broad dollar index now sits at a technically pivotal zone below the 98.00 handle, with analysts warning that further deterioration risks opening the door to an extended phase of USD softness. Over the past month alone, the dollar has weakened 0.90%, creating a favorable environment for dollar-denominated commodities like gold.
Several factors are contributing to sustained dollar weakness:
Federal Reserve Policy Uncertainty: The Federal Reserve has transitioned from restrictive policy to a cautious easing cycle, with rates currently at 3.50%-3.75% following three consecutive 25-basis-point cuts. Markets widely expect the Fed to maintain rates at the upcoming January 26-28, 2026 meeting, with 97.2% of market participants anticipating no change.
Looking ahead, bond futures markets are pricing in 50 basis points of additional easing in 2026, equivalent to two 25-point cuts, with increased probability of action by April and September. This dovish outlook reduces the opportunity cost of holding non-yielding assets like gold, making the precious metal more attractive to investors.
Political Concerns: Justice Department subpoenas directed at Federal Reserve Chair Jerome Powell have heightened market concerns about the Fed's independence, adding downside risk to the USD. President Trump has publicly voiced strong support for rate cuts and is believed to favor his staffer Kevin Hassett to replace Powell when his term ends. A leadership change could fundamentally shift the Fed's approach, potentially creating additional uncertainty that favors gold as a safe-haven asset.
Economic Projections: The Fed's December projections indicate an interest rate target of 3.1% by 2028, implying gradual easing over the next two years. Some economists, including Mark Zandi of Moody's Analytics, anticipate more aggressive easing, forecasting three rate cuts in the first half of 2026 alone, driven by labor market softness and inflation uncertainties.
Geopolitical Tensions: Safe-Haven Demand Intensifies
Geopolitical uncertainty has emerged as a critical driver of gold's rally, with several flashpoints creating sustained safe-haven demand.
US-European Trade Tensions: President Donald Trump's intensifying push to acquire Greenland has fueled fears of a damaging trade war between the United States and Europe. Trump threatened to impose 10% tariffs on eight European Union nations—including France, Germany, and the United Kingdom—set to take effect February 1, 2026, if his Greenland ambitions are blocked.
This aggressive stance prompted the European Union to consider retaliatory measures, including tariffs on $108 billion worth of American goods, new fees on US imports and services, and potentially banning American firms from bidding for public contracts. EU ambassadors met on January 18 to discuss response options, highlighting the seriousness of the diplomatic rift.
The announcement of these tariff threats caused gold to surge as much as 2.1% to near $4,700 per ounce in mid-January, while Trump's aggression weighed heavily on the dollar and buoyed demand for safe-haven assets. Silver joined the rally, surging as much as 4.4% as geopolitical anxiety spread across precious metals markets.
Ongoing Global Uncertainties: Beyond the US-European tensions, commodity market experts continue monitoring geopolitical hotspots in Venezuela, Iran, and other regions that could potentially trigger additional safe-haven flows into gold. The persistence of these multiple risk factors creates a sustained bid under gold prices, as institutional and sovereign investors seek protection from potential geopolitical shocks.
Reduced Geopolitical Premium: While the fundamental geopolitical risk remains elevated, gold experienced a brief correction from all-time highs when Trump softened his rhetoric toward Europe, abandoned immediate tariff threats linked to Greenland, and ruled out the use of force. This temporary reduction in the geopolitical premium triggered profit-taking, yet prices remained supported above $4,750, demonstrating the underlying strength of the bull market.
Central Bank Gold Accumulation: Structural Demand
One of the most significant long-term drivers of gold's ascent is the systematic and sustained accumulation by central banks worldwide, particularly among emerging market economies.
China's Strategic Buying: China's central bank has continued its gold acquisition streak for an unprecedented 14 consecutive months through December 2025. By systematically adding between 30,000 and 40,000 ounces to its reserves monthly, China has signaled a long-term policy goal of reducing reliance on US Treasuries.
By the start of 2026, China's official gold reserves reached an estimated 2,306 metric tons, reflecting a strategic shift to insulate the world's second-largest economy from potential currency weaponization and fiscal instability in the West. This policy of diversification away from dollar-denominated assets—often referred to as "de-dollarization"—has moved from fringe financial circles into the boardrooms of major asset managers and sovereign wealth funds.
Broader Central Bank Participation: Goldman Sachs forecasts that central bank purchases will average 60 metric tons per month as emerging-market central banks continue diversifying reserves into gold. This systematic buying provides a stable and predictable source of demand that supports prices even during periods of profit-taking or temporary risk-off sentiment in financial markets.
The scale and consistency of this official sector demand represents a structural shift in the global monetary system. Unlike cyclical investment flows that can reverse quickly, central bank accumulation reflects long-term strategic decisions based on monetary policy, geopolitical considerations, and reserve diversification objectives.
Record ETF Inflows: Institutional Conviction
The massive return of Western institutional investors to the gold market has provided another critical pillar of support for prices.
Throughout 2025, a record $89 billion flowed into gold-backed ETFs, reversing years of stagnant or negative flows. This surge was catalyzed by the de-dollarization narrative, sticky inflation that proved more persistent than central banks anticipated, and the US national debt's continued upward trajectory.
Record inflows into gold-backed ETFs constitute a significant portion of total demand for physical gold. As Manc, portfolio manager of the Gabelli Gold Fund, explained: "Holding gold, which yields nothing, comes with an opportunity cost. As interest rates drop, this cost diminishes. If the Fed persists in lowering rates in 2026, gold demand should increase".
The timeline of institutional accumulation during 2025 reached approximately 1,073 metric tons held by gold ETFs by early 2026, representing a momentum profile that analysts describe as "difficult to ignore". This level of institutional participation provides strong price support during temporary pullbacks and suggests that professional money managers view current levels as attractive for long-term positioning.
Inflation Dynamics and Real Interest Rates
While inflation has moderated from pandemic-era peaks, it remains above central bank targets, creating a supportive environment for gold as an inflation hedge.
The Federal Reserve's preferred inflation measure, Core Personal Consumption Expenditures (PCE), has stalled at 2.8%, above the 2% target. This persistence of elevated inflation, combined with the Fed's cautious approach to further rate increases, has kept real interest rates (nominal rates minus inflation) relatively low, reducing the opportunity cost of holding non-yielding gold.
The Fed faces conflicting pressures between rising unemployment—which increased from 4.0% in January 2025 to 4.4% by year-end—and inflation progress that has stalled. This dual mandate challenge presents arguments for maintaining accommodative policy, which traditionally benefits gold prices.
Recent PCE data releases have caused sharp reactions in gold markets, with inflation expectations, Fed policy, and risk sentiment colliding to push gold into aggressive price action. The interplay between inflation data, central bank policy responses, and gold prices will remain a critical focus for traders throughout 2026.
Supply and Demand Dynamics
Beyond investment demand, the fundamental supply-demand balance for physical gold remains supportive of higher prices.
Analysts warn that US tariffs on European nations could disrupt expected flows of silver inventories between COMEX and London Bullion Market Association (LBMA) warehouses, potentially creating spillover effects in precious metals markets. This supply chain uncertainty may contribute to tighter market conditions and provide additional upward pressure on prices.
The combination of strong jewelry demand from Asian markets, industrial applications, central bank purchases, and investment demand through ETFs continues to absorb available supply, preventing the accumulation of excess inventory that would pressure prices lower.
Market Sentiment and Positioning
Current market sentiment toward gold is overwhelmingly bullish, though not yet at extreme levels that would signal an imminent reversal.
The Commitment of Traders (COT) data, while not explicitly provided in recent reports, typically shows elevated speculative long positions during such strong uptrends. However, the participation of systematic central bank buyers and long-term institutional investors suggests that the market structure is more stable than purely speculative rallies that are vulnerable to rapid reversals.
Traders and analysts note that while all technical indicators have reached strong overbought levels, the fundamental drivers remain sufficiently robust to support a push beyond the $5,000 per ounce psychological level. The persistence of multiple bullish catalysts—dollar weakness, geopolitical tensions, central bank buying, and ETF inflows—creates a market environment where traditional overbought signals may remain ineffective for extended periods.
Options Market Positioning
Options market activity (where available data exists) typically shows increased call buying at higher strikes during strong bull markets, indicating that traders are positioning for further upside rather than hedging long positions. The elevated implied volatility in gold options reflects market expectations for continued large price movements, whether higher or through temporary corrections.
Key Events and Risk Factors for January 27, 2026
Federal Reserve Meeting (January 26-28, 2026)
The Federal Open Market Committee (FOMC) meeting scheduled for January 26-28, 2026, represents the most significant near-term event risk for gold markets.
While markets overwhelmingly expect the Fed to maintain the federal funds rate at 3.50%-3.75%, the accompanying statement and press conference from Chair Powell will provide critical guidance on the central bank's outlook for future policy actions. Any dovish signals suggesting openness to additional rate cuts later in 2026 would likely support gold prices, while hawkish rhetoric emphasizing data dependency and potential pauses in easing could temporarily pressure the metal.
The statement will be scrutinized for language changes regarding inflation progress, labor market assessment, and the economic outlook. Chair Powell's press conference typically generates significant volatility in financial markets as traders parse his responses to questions about policy direction.
Speech by President Trump (January 28, 2026)
A scheduled speech by President Donald Trump on January 28, 2026, adds an additional layer of uncertainty and potential volatility. Given recent trade tensions with Europe over Greenland and tariff threats, markets will be highly sensitive to any comments regarding trade policy, tariffs, or international relations.
Trump's public statements have historically moved markets significantly, particularly when they involve trade policy or criticism of Federal Reserve policy. Any escalation of trade rhetoric could trigger additional safe-haven flows into gold, while de-escalation might prompt profit-taking from recent highs.
Economic Data Releases
US Durable Goods Orders: Scheduled for release during the week, durable goods orders provide insight into business investment and manufacturing sector health. Strong data would support the dollar and potentially pressure gold, while weakness would reinforce the case for continued Fed easing and benefit the precious metal.
Other Economic Indicators: Various secondary economic indicators will be released throughout the week, including regional manufacturing surveys, consumer confidence measures, and housing market data. Collectively, these data points will shape market expectations for Fed policy and economic growth, influencing gold's direction.
Potential Downside Risks
While the fundamental and technical picture remains strongly bullish, traders should be aware of potential risks that could trigger temporary corrections:
Profit-Taking: After the substantial rally from lower levels, some investors may choose to lock in profits, particularly if gold approaches the $5,220-$5,300 resistance zone. This technical selling could create short-term downward pressure even if the underlying trend remains intact.
Stronger-Than-Expected Dollar: Any surprise strengthening in the US Dollar Index could pressure gold prices, given the strong inverse correlation between the two assets. This could occur if Fed officials adopt unexpectedly hawkish language or if geopolitical tensions ease more substantially than anticipated.
Risk-On Rotation: If equity markets experience a strong rally or if broader risk sentiment improves substantially, some capital could rotate out of safe-haven assets like gold into higher-yielding equities or credit instruments. However, this scenario appears less likely given current geopolitical uncertainties and economic crosscurrents.
Technical Correction Completion: The market has been consolidating near all-time highs, and technical analysts note that the upward movement following the flag pattern breakout may be nearing completion. A deeper correction toward the $4,700-$4,750 support zone remains possible before the next leg higher, though the uptrend would remain intact as long as prices hold above the $4,600 level.
Trading Strategy and Risk Management
Position Sizing and Entry Strategy
Given the strong bullish trend but elevated price levels, a layered entry approach offers optimal risk-reward characteristics:
Aggressive Traders: Can enter long positions at current market levels around $5,090, given the strong momentum and multiple bullish catalysts. This approach accepts lower risk-reward ratios in exchange for high probability of trend continuation and avoids the risk of missing further upside if prices accelerate directly to higher targets.
Moderate Traders: Should wait for minor pullbacks to the $5,040-$5,070 zone, where support from recent consolidation and round-number psychology converge. This approach improves entry price while maintaining exposure to the dominant trend.
Conservative Traders: Can employ limit orders in the $4,940-$4,980 range, targeting deeper retracements that may occur if profit-taking intensifies or if Fed/Trump communications disappoint. This strategy maximizes risk-reward ratios but accepts the possibility of not being filled if prices continue higher without significant correction.
Stop Loss Placement
Aggressive Stop Loss: $4,900 per ounce represents the first major support level and the point at which the near-term bullish structure would begin to deteriorate. This tighter stop reduces capital at risk but increases the probability of being stopped out by normal market noise.
Conservative Stop Loss: $4,770 per ounce sits below multiple support levels and represents a clear break of the ascending channel structure. This wider stop provides more room for market fluctuation but requires larger position sizes to be reduced proportionally to maintain appropriate risk levels.
Very Conservative Stop Loss: $4,700 represents the major support floor from the previous consolidation zone. A break below this level would indicate a more significant correction is underway, though the long-term uptrend would not necessarily be compromised.
Profit-Taking Strategy
Target 1 ($5,153): This represents the upper end of the forecast range for January 27, 2026. Conservative traders should consider taking partial profits (25-33% of position) at this level to lock in gains.
Target 2 ($5,220): This key resistance level represents a significant technical barrier. Traders should consider reducing positions by an additional 25-50% at this level, allowing remaining positions to run toward extended targets.
Target 3 ($5,300): This major resistance level represents the upper boundary of the current price channel. Final profit-taking should occur at this level, or trailing stops should be tightened to protect accumulated gains.
Beyond $5,300: If prices break clearly above $5,300 with strong volume and momentum, the technical picture would suggest a continuation toward uncharted territory. In this scenario, trailing stops should be raised to protect profits while allowing the position to capture potential further upside.
Alternative Strategies
Options Strategies: Traders comfortable with options can consider buying call options or call spreads as an alternative to outright long positions. This approach limits downside risk to the premium paid while maintaining upside exposure. Given elevated implied volatility, selling put spreads may also be attractive for generating premium income while establishing defined-risk long exposure.
Scale-In Approach: Rather than committing full position size at once, traders can scale into positions by allocating capital in thirds or quarters at different price levels. This approach reduces timing risk and provides flexibility to adjust to evolving market conditions.
Forecast for January 27, 2026
Based on the comprehensive technical and fundamental analysis, the most probable scenario for January 27, 2026, involves:
Base Case (65% probability): Gold continues its consolidation phase between $5,040 and $5,153, digesting recent gains and awaiting catalysts from the Fed meeting and Trump speech. Intraday volatility remains elevated, but prices hold above critical support at $5,040, keeping the bullish structure intact. This environment favors range-trading strategies and accumulation on dips.
Bullish Case (25% probability): Dovish signals from the Fed or escalating trade tensions from Trump's comments trigger a breakout above $5,153 toward the $5,220 resistance level. Safe-haven flows intensify, ETF inflows accelerate, and momentum indicators remain in bullish territory. This scenario would validate aggressive long positions and suggest further upside potential in coming days.
Bearish Case (10% probability): Unexpectedly hawkish Fed messaging or de-escalation of trade tensions triggers profit-taking that pushes prices toward the $4,940-$4,980 support zone. While this would create short-term downward pressure, the correction would likely be viewed as a healthy pullback within the broader uptrend, attracting buying interest from longer-term investors. A break below $4,900 would increase the probability of deeper correction toward $4,770-$4,700, though the primary trend would remain bullish.
Conclusion
The gold market enters January 27, 2026, with exceptional fundamental support and robust technical structure that favors continued upside potential. The convergence of US dollar weakness, geopolitical tensions, record central bank accumulation, massive ETF inflows, and accommodative monetary policy expectations creates a rare alignment of bullish catalysts.
While prices have reached historically elevated levels and technical indicators show overbought conditions, the persistence of multiple fundamental drivers suggests that traditional sell signals may remain ineffective for extended periods. The market structure appears stable, supported by institutional and sovereign buying rather than purely speculative positioning.
Key event risks from the Federal Reserve meeting and President Trump's speech will likely determine near-term direction, with dovish policy signals or trade escalation supporting further gains, while hawkish pivots or diplomatic de-escalation could trigger temporary corrections.
For traders and investors, the strategic approach should balance the strong bullish bias with appropriate risk management given elevated price levels. Long positions remain favored, with protective stops below major support levels and profit-taking strategies at defined resistance zones. The technical picture suggests that any pullbacks toward the $4,940-$5,040 support zone represent attractive buying opportunities within the context of the dominant uptrend.
The gold market of 2026 is defined by structural shifts in the global monetary system—central bank diversification, institutional safe-haven allocation, and persistent geopolitical uncertainty—that appear likely to support prices well beyond current levels over the medium to long term. Short-term volatility and corrections should be expected and embraced as opportunities rather than threats to the primary trend.
Recommended Action for January 27, 2026: Maintain bullish bias with long positions, use pullbacks to accumulate, implement disciplined risk management with stops below $4,900, and take partial profits at resistance levels while allowing remaining positions to capture extended upside potential.
Disclaimer: This analysis is provided for educational purposes only and does not constitute financial advice. Trading in gold and forex markets involves substantial risk of loss and may not be suitable for all investors. Past performance is not indicative of future results. Always conduct your own research and consider consulting with a qualified financial advisor before making investment decisions.
Comments ()