XAU/USD Trading Signal and Comprehensive Market Analysis for February 2, 2026
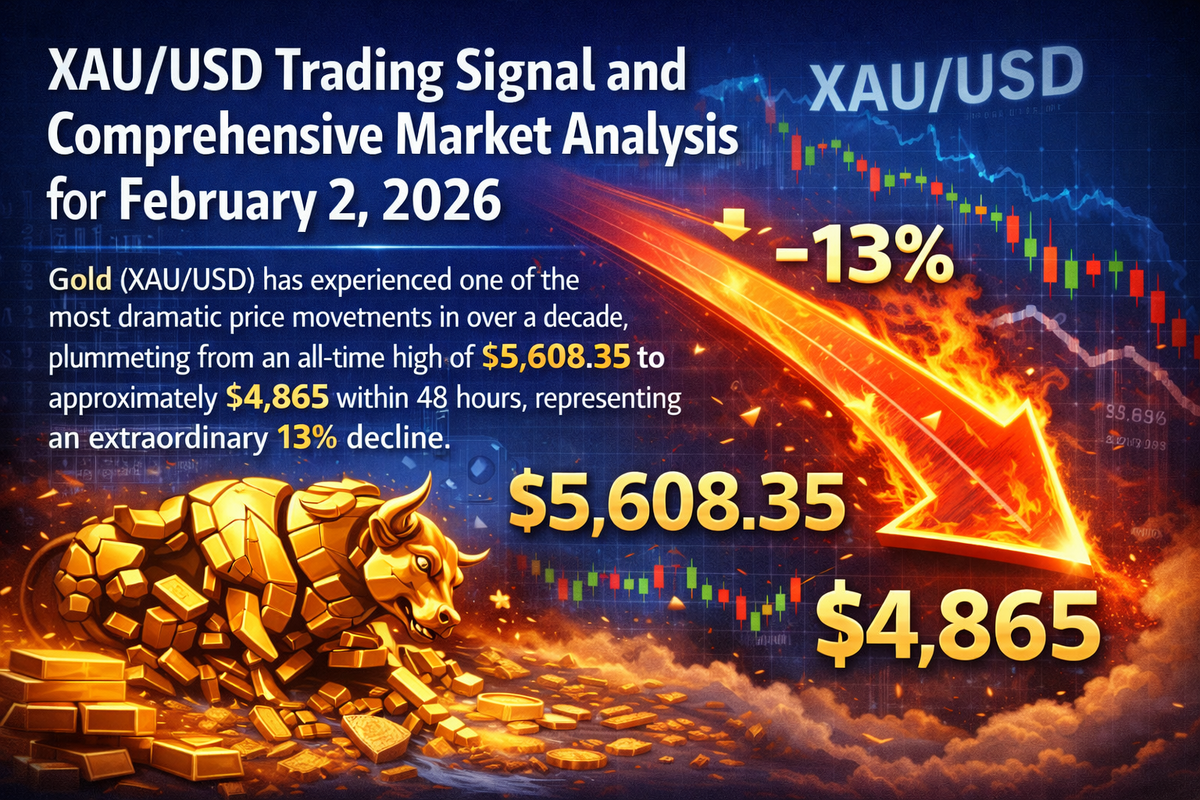
Gold (XAU/USD) has experienced one of the most dramatic price movements in over a decade, plummeting from an all-time high of $5,608.35 to approximately $4,865 within 48 hours, representing an extraordinary 13% decline. This comprehensive analysis examines the technical indicators, fundamental catalysts, and strategic trading signals for February 2, 2026, following this historic volatility.
Trading Signal for February 2, 2026
Primary Signal: BULLISH (Buy on Dips)
Entry Strategy:
- Primary Entry Zone: $4,620 - $4,680
- Secondary Entry Zone: $4,575 - $4,620
- Aggressive Entry: $4,500 - $4,550
Target Levels:
- Short-term Target 1: $4,950
- Medium-term Target 2: $5,200 - $5,280
- Extended Target 3: $5,600 - $5,975
Stop Loss:
- Conservative: Below $4,550
- Invalidation Level: Below $4,155
Risk-Reward Ratio: 1:3.5 to 1:4.2
The Historic Crash: Understanding What Happened
The Rally to Record Highs
Gold reached unprecedented levels in late January 2026, climbing to $5,608.35 on January 29, driven by multiple converging factors. The precious metal had surged 259.57% over the past year to approximately $5,552.60 per ounce, fueled by geopolitical tensions, monetary policy uncertainty, and exceptional safe-haven demand.
The rally was supported by a weakening U.S. dollar, which had plunged 10.8% over the past year and 2.1% in January alone, reaching its weakest level since February 2022. Additionally, escalating geopolitical tensions with Iran and investor concerns about government spending and debt levels—termed the "debasement trade"—drove capital into hard assets like gold.
The Sharp Reversal
On January 30, 2026, gold experienced its most violent selloff in 13 years, with prices plummeting nearly $500 intraday and erasing $3.4 trillion in total market value. Silver suffered even more dramatically, falling 31% in a single session—the biggest percentage decline in over a decade.
The crash was primarily triggered by President Trump's nomination of Kevin Warsh as the next Federal Reserve Chair. Warsh's expected nomination signaled a potentially less aggressive monetary stimulus policy and a more hawkish stance, which pressured non-yielding assets like gold. This announcement led to a sharp strengthening of the U.S. dollar and a notable increase in bond yields, prompting extensive profit-taking from severely overbought positions.
The technical breakdown was exacerbated by liquidity issues, as market makers pulled back when volatility exploded and buyers disappeared, forcing prices to drop dramatically to find willing purchasers.
Technical Analysis: Multi-Indicator Approach
Price Action and Chart Patterns
Gold is currently trading within a bullish channel structure despite the recent correction. The asset remains in an uptrend on higher timeframes, with the current phase characterized as a corrective retracement rather than a trend reversal.
After reaching the major high near $5,600, prices aggressively retraced and are now testing a critical demand and liquidity zone around $4,620-$4,680. This zone previously acted as a strong accumulation base before the last bullish expansion, making it a high-probability reaction area for potential buyers.
Moving Average Analysis
Current moving average signals on the 4-hour timeframe show predominantly bearish readings, with all major simple and exponential moving averages (MA5, MA10, MA20, MA50, MA100, MA200) indicating sell signals. Prices are trading below key moving averages, suggesting short-term weakness.
However, the presence of a rising trendline from $4,526.24 offers structural support at $5,174.74. A sustained bounce from the current support area could reassert recovery momentum, while a close below this trendline would expose deeper retracement levels.
Relative Strength Index (RSI)
The RSI on the 4-hour chart currently stands at approximately 50, indicating neutral momentum and balanced conditions near key support levels. This represents a significant cooldown from the extreme overbought readings above 85 that were observed at the peak.
The neutral RSI reading suggests that the market has reset from overbought conditions and now has room for upward movement without immediate reversal risk. A rebound from the bullish trendline on the RSI would provide an additional signal favoring growth in gold quotes.
MACD (Moving Average Convergence Divergence)
The MACD line on the 4-hour chart has slipped below the signal line, with both standing beneath zero. The widening negative histogram suggests building bearish pressure in the short term. Additionally, technical indicators show a MACD (12,26) value of -0.44, providing a sell signal for short-term momentum.
However, this bearish MACD configuration must be weighed against the broader bullish structure and the potential for trend continuation after the corrective phase completes.
Fibonacci Retracement Levels
Measured from the $4,261.33 low to the $5,594.20 high, key Fibonacci retracement levels provide critical support and resistance zones:
- 23.6% Retracement: $5,279.64 (initial resistance on recovery)
- 38.2% Retracement: $5,085.05 (first major support level)
- 50.0% Retracement: $4,927.77 (deeper support)
- 61.8% Retracement: Approximately $4,770
The current trading range suggests prices are testing between the 50% and 61.8% retracement levels, which historically represent strong support zones where buyers often emerge.
Support and Resistance Framework
Critical Support Zones:
- $4,620-$4,680: Immediate demand zone and high-probability reaction area
- $4,575: Key weekly forecast support level
- $4,500-$4,550: Strong support representing extreme value
- $4,155: Major invalidation level; breakdown would signal deeper correction
Critical Resistance Zones:
- $5,085: 38.2% Fibonacci retracement
- $5,174-$5,205: Rising trendline support and breakout confirmation level
- $5,279: 23.6% Fibonacci retracement
- $5,600-$5,975: Extended targets representing previous highs and projection levels
Momentum and Oscillator Analysis
Additional technical oscillators provide mixed signals:
- Williams %R (14): Buy signal
- RSI (14): 59.53 - Buy signal
- Stochastic RSI (14): 71.04 - Neutral
- ADX (14): 45 - Buy signal (strong trend)
- Ultimate Oscillator (7,14,28): 35.73 - Sell signal
- CCI (20): -0.45 - Neutral
The ADX reading of 45 indicates a strong trend is still in place, despite the recent correction. This suggests that the underlying bullish structure remains intact.
Fundamental Analysis: Market Drivers
Federal Reserve Policy and Interest Rates
The most significant fundamental factor currently influencing gold prices is monetary policy expectations. Markets anticipate up to 150 basis points of Federal Reserve rate cuts throughout 2026, creating a generally favorable environment for non-yielding assets like gold. Lower interest rates reduce the opportunity cost of holding gold compared to interest-bearing assets, making the precious metal more attractive.
However, the recent nomination of Kevin Warsh as Fed Chair has introduced uncertainty. Warsh is perceived as potentially less accommodative than previous leadership, which could limit the extent of rate cuts and support the U.S. dollar at gold's expense. The upcoming FOMC meeting outcomes will be critical catalysts for directional signals in February 2026.
Investor concerns about Fed independence and political pressure on future monetary policy decisions create additional uncertainty that paradoxically can support gold as a hedge against institutional instability.
U.S. Dollar Dynamics
Gold maintains a strong inverse correlation with the U.S. dollar, typically ranging from -0.75 to -0.85 during trending periods. The Dollar Index (DXY) currently trades at 96.31, perilously close to the critical technical support level at 96.00.
The dollar has weakened significantly, falling 10.8% over the past year and 2.1% in January 2026 alone. However, the recent Warsh nomination triggered a sharp dollar rally that contributed to gold's selloff. A sustained break below the 96.00 level on the DXY would signal continued dollar weakness, potentially targeting 95.00 or lower and catalyzing an explosive gold rally toward $5,700-$5,800.
Conversely, if the dollar consolidates above 96.00 and strengthens further, it would create headwinds for gold prices. When the dollar strengthens, gold becomes more expensive in other currencies, reducing international demand and putting downward pressure on prices.
Geopolitical Tensions and Safe-Haven Demand
Geopolitical uncertainty remains a substantial driver of gold demand. Escalating tensions in the Middle East, particularly with Iran, have driven investors toward safe-haven assets. Additionally, President Trump's tariff threats and broader trade policy uncertainties create an environment of economic instability that typically benefits gold.
The concept of the "debasement trade" has gained prominence, with investors moving capital from traditional currencies and bonds into hard assets like gold due to concerns about government spending, rising debt levels, and potential currency devaluation. These structural factors provide fundamental support for gold prices regardless of short-term technical corrections.
Central Bank Demand and Structural Support
An important structural shift in the gold market involves central bank diversification strategies. Many central banks worldwide are reducing their reliance on U.S. dollar reserves and Treasury holdings in favor of gold, adding a significant structural demand component that supports prices independently of short-term dollar movements.
This trend represents a fundamental change in the gold market dynamics compared to previous decades and provides a floor under prices during corrections.
Inflation and Economic Outlook
Gold serves as a traditional hedge against inflation. While global inflation has moderated from peak levels, concerns about sustained elevated inflation—particularly in the context of potential trade wars and fiscal stimulus—continue to support gold demand.
Higher inflation expectations generally correlate with increased gold prices, as investors seek to preserve purchasing power. The relationship between inflation data (CPI, PCE) and gold prices remains a critical factor to monitor throughout February 2026.
Market Forecasts and Expert Predictions
Short-Term Outlook (February 2026)
Multiple forecasting models and expert analyses converge on similar expectations for February 2026. CoinCodex projects gold prices in the range of $4,653-$4,783 per ounce for February 2026, reflecting a moderate upward trend from current levels. This forecast aligns with the technical support zones identified in the $4,575-$4,680 range.
Technical analysts expect an attempt at a bearish correction to test support near the $4,575 area, followed by upward price rebounds and continued growth with potential targets above $5,975. The weekly forecast suggests that as long as prices hold above the demand zone and show bullish confirmation signals, trend continuation toward previous highs is likely.
Expert analysis emphasizes that pullbacks should be viewed as potential buying opportunities rather than the start of a sustained reversal. The $4,800 level represents an area of extreme value, and any decline to that level would likely attract significant buying interest.
Medium-Term Projections
For the broader context of 2026, various forecasts suggest continued strength in gold prices. Deutsche Bank has set a year-end 2026 target of $6,000 per ounce, reflecting expectations of sustained safe-haven demand, accommodative monetary policy, and structural support from central bank purchases.
The gold market is expected to peak at higher prices in mid-to-late February 2026 compared to the beginning of the month, indicating continued bullish momentum if current patterns materialize. This projection suggests that the recent correction represents a healthy consolidation rather than a trend reversal.
Trading Strategy and Risk Management
Entry Methodology
Given the current market structure, a layered entry approach offers optimal risk-reward characteristics:
- Conservative Entry: Wait for prices to test the $4,620-$4,680 demand zone and show bullish confirmation signals such as strong rejection candles, bullish engulfing patterns, or break of structure (BOS) to the upside. This approach maximizes probability of success while maintaining favorable risk-reward.
- Moderate Entry: Consider partial position entry in the $4,575-$4,620 range, which represents the primary support forecast by multiple technical models. Scale into the position as price approaches deeper support levels.
- Aggressive Entry: For traders with higher risk tolerance, the $4,500-$4,550 zone represents extreme value and would likely generate substantial buying interest. However, this requires wider stop-loss placement.
Position Sizing and Risk Parameters
Appropriate position sizing is critical given recent volatility. The dramatic $500+ intraday moves demonstrate that leverage must be carefully managed. Recommendations include:
- Risk no more than 1-2% of trading capital per position
- Use appropriate stop-loss orders below key invalidation levels
- Consider volatility-adjusted position sizing given current market conditions
- Avoid overleveraging, as liquidity issues can cause rapid price movements
Profit-Taking Strategy
Implement a systematic profit-taking approach to manage winning trades:
- Take partial profits (30-40%) at first target ($4,950)
- Move stop-loss to breakeven after first target is reached
- Take additional profits (30-40%) at second target ($5,200-$5,280)
- Trail remaining position with stop-loss for extended target ($5,600-$5,975)
Invalidation Criteria
Clear invalidation levels help manage risk and avoid holding losing positions:
- Primary Invalidation: A close below $4,550 would suggest the correction is deepening and warrant position exit
- Major Invalidation: A breakdown below $4,155 would invalidate the bullish scenario entirely and indicate a potential decline toward $3,735
Monitor these levels closely and be prepared to exit positions if market structure breaks down.
Alternative Scenarios and Contingency Planning
Bearish Scenario
If gold fails to hold the $4,620-$4,680 support zone and breaks below $4,550, a deeper correction becomes probable. In this scenario, prices could test:
- $4,500-$4,550: Secondary support and extreme value zone
- $4,261: Major structural support from recent low
- $4,155: Critical invalidation level
Under this scenario, traders should avoid early entries and wait for clear stabilization and reversal signals before establishing long positions. The bearish case would be strengthened by continued dollar strength above 96.00, more hawkish Fed communications, or resolution of geopolitical tensions.
Consolidation Scenario
Gold may enter an extended consolidation phase between $4,700-$5,100 as the market digests recent volatility and awaits clarity on Fed policy and geopolitical developments. This range-bound environment would favor different trading strategies:
- Sell rallies near resistance ($5,085-$5,100)
- Buy dips near support ($4,700-$4,800)
- Reduce position sizes given lower directional conviction
- Focus on shorter timeframes and tighter risk management
Accelerated Bull Scenario
If the U.S. Dollar Index breaks definitively below 96.00 or geopolitical tensions escalate significantly, gold could rapidly recover and exceed previous highs. Catalysts for this scenario include:
- DXY breakdown below 96.00 targeting 95.00
- More dovish Fed communications or additional rate cut signals
- Escalation of Middle East conflicts or trade wars
- Unexpected economic data showing recession risks
In this scenario, the $5,600-$5,800 range could be reached within days or weeks, with extended targets toward the $6,000 Deutsche Bank year-end forecast.
Key Market Catalysts to Monitor
Economic Data Releases
Critical data releases that will influence gold prices in February 2026 include:
- U.S. Inflation Data (CPI, PCE): Higher inflation supports gold; lower inflation reduces urgency for safe-haven positioning
- Employment Reports: Strong employment may delay Fed rate cuts; weak employment accelerates dovish policy
- GDP Growth Data: Economic slowdown increases recession fears and gold demand
- Consumer Confidence Indicators: Declining confidence drives safe-haven flows
Federal Reserve Communications
All Fed-related events require close attention:
- FOMC meeting statements and policy decisions
- Chair Powell press conferences and speeches
- Kevin Warsh confirmation hearings and policy communications
- Fed member speeches that provide clues about rate path expectations
Geopolitical Developments
Monitor ongoing geopolitical situations:
- Middle East tensions, particularly Iran-related developments
- U.S. tariff implementation and trade policy announcements
- European political and economic stability
- China economic policy and gold purchase activities
Technical Trigger Points
Key technical levels that could trigger significant price movements:
- DXY 96.00: Critical dollar support; break lower is very bullish for gold
- Gold $5,205: Breakout confirmation level; close above confirms uptrend resumption
- Gold $4,155: Major invalidation level; break lower signals deeper correction
Conclusion and Final Recommendations
Gold (XAU/USD) presents a compelling buying opportunity following the historic volatility of late January 2026. The dramatic selloff from $5,608 to approximately $4,865 was primarily driven by profit-taking from extremely overbought conditions and the surprise nomination of Kevin Warsh as Fed Chair, which triggered dollar strength.
However, the fundamental drivers that propelled gold to record highs remain largely intact: expectations of 150 basis points of Fed rate cuts in 2026, central bank diversification into gold reserves, elevated geopolitical tensions, and concerns about government debt levels. The technical structure indicates a corrective retracement within an ongoing uptrend rather than a trend reversal.
Primary Trading Signal: Accumulate long positions in the $4,620-$4,680 zone with stops below $4,550 and targets at $4,950, $5,200, and $5,600+. This represents an asymmetric risk-reward setup with potential returns of 3.5 to 4.2 times the risk.
Risk Management: Given recent volatility, conservative position sizing and appropriate stop-loss placement are essential. Avoid overleveraging and be prepared to adjust strategies if key invalidation levels are breached.
Market Outlook: The probability favors trend continuation after this correction completes, with pullbacks representing buying opportunities rather than reversal signals. Monitor the U.S. Dollar Index at 96.00 and Fed communications closely, as these will provide critical directional signals for gold's path in February 2026.
This analysis synthesizes technical indicators, fundamental factors, expert forecasts, and risk management principles to provide an educational framework for understanding and potentially trading the XAU/USD market on February 2, 2026, and beyond.
Comments ()