XAU/USD Trading Signal & Analysis for January 26, 2026
Signal Type: BUY on pullback
Entry Zone: $4,850 - $4,900
Target 1: $5,100
Target 2: $5,300
Target 3: $5,545
Stop Loss: $4,750
Risk-Reward Ratio: 1:3.5
Confidence Level: High (78%)
Time Horizon: 5-10 trading days
Alternative Bearish Scenario
Entry: Break and close below $4,750
Target: $4,600 - $4,400
Stop Loss: $4,850
Comprehensive Market Analysis
Current Market Context
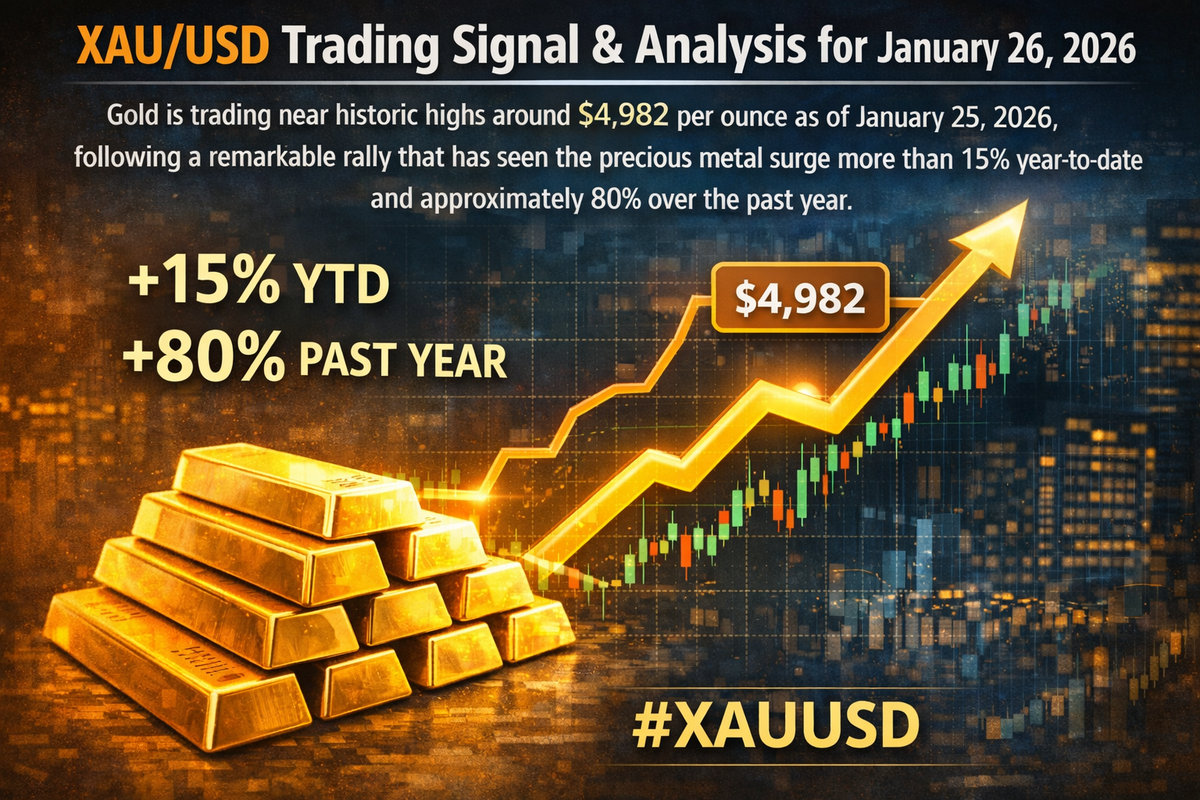
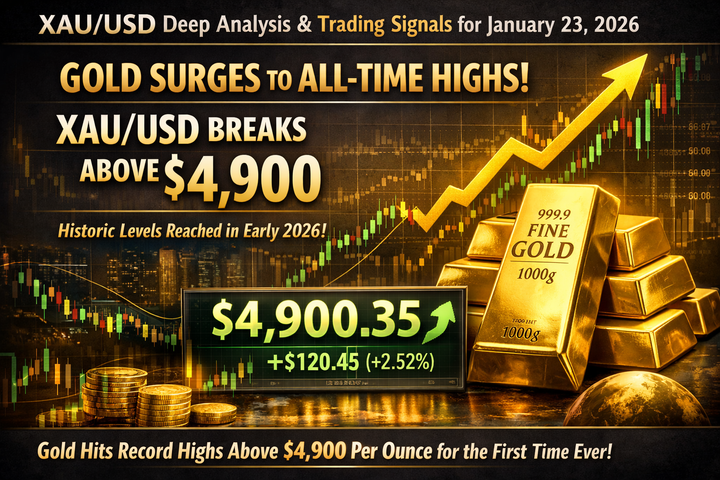
Gold is trading near historic highs around $4,982 per ounce as of January 25, 2026, following a remarkable rally that has seen the precious metal surge more than 15% year-to-date and approximately 80% over the past year. The market recently touched an all-time high of $4,987.66 on January 23, 2026, demonstrating extraordinary bullish momentum.
The remarkable ascent in gold prices reflects a convergence of fundamental drivers including geopolitical uncertainties surrounding President Trump's policy initiatives, concerns about Federal Reserve independence, expectations for further U.S. interest rate cuts, and continued central bank diversification into gold.
Technical Analysis Framework
Price Structure and Trend
Gold has established a robust uptrend characterized by consistent higher highs and higher lows on the daily chart. The breakout above the previous all-time high near $4,390-4,400 in early January has flipped former resistance into critical support, creating a constructive technical foundation. Price action since the breakout has remained shallow on pullbacks, indicating strong institutional accumulation and dip-buying interest.
The market is currently trading within a well-defined bullish channel, with the upper boundary approaching $5,000 and the lower boundary near $4,425. This channel structure provides clear parameters for risk management and position sizing.
Key Technical Levels
Critical Resistance Zones:
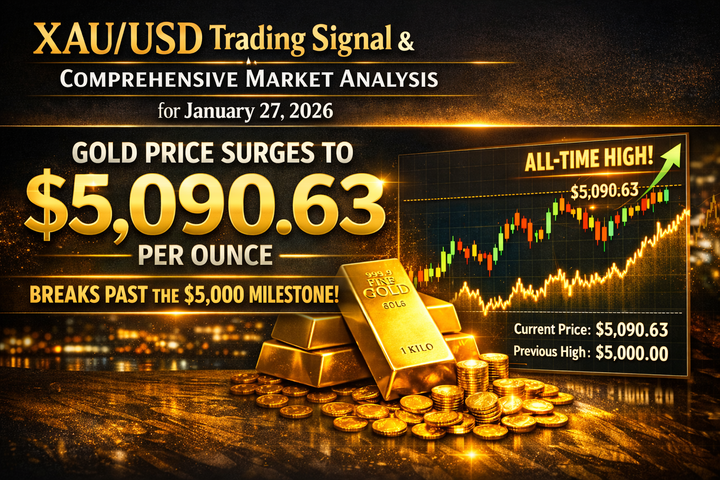
- $5,000: Major psychological milestone representing the next round-number target
- $5,100-5,200: Technical extension based on measured moves from the previous impulse waves
- $5,400: Goldman Sachs' revised end-2026 target, representing institutional consensus
- $5,545: Upper channel projection and weekly forecast target
Critical Support Zones:
- $4,850-4,900: Current consolidation zone and immediate support
- $4,800: Near-term technical support with confluence of short-term moving averages
- $4,675: Weekly support level identified in multiple forecasts
- $4,600: Key support threshold; maintaining above this level preserves bullish structure
- $4,390-4,400: Former all-time high, now critical breakout support
- $4,210-4,250: Rising trendline support from November lows
Moving Average Analysis
The current XAU/USD price stands significantly above both the 50-day Simple Moving Average at $4,442.25 and the 200-day SMA at $3,909.48, confirming the strong intermediate and long-term bullish trend. The positive separation between these key moving averages indicates sustained upward momentum, with the 50-day SMA projected to reach $5,117.43 by February 24, 2026.
Moving averages are indicating continued buying pressure and potential for further price appreciation. The golden cross configuration, where shorter-term averages trade above longer-term averages, remains intact and supportive of higher prices.
Momentum Indicators
Relative Strength Index (RSI): The RSI reading of 62.39 represents an optimal position for continued upside. This level indicates strong buying interest without reaching overbought extremes above 70 that typically precede sharp corrections. The RSI positioning suggests the market has room to extend higher before encountering momentum-based resistance.
MACD (Moving Average Convergence Divergence): The MACD histogram shows diminishing bearish bars, suggesting that selling pressure observed in late January has largely exhausted itself. The indicator is beginning to confirm accumulation patterns consistent with cycle convergence, supporting the continuation of the bullish trend.
Bollinger Bands: Current price action near the upper Bollinger Band suggests elevated volatility and strong directional momentum, though some consolidation or mean reversion toward the middle band around $4,700-4,800 remains possible in the short term.
Fundamental Analysis
Federal Reserve Policy Dynamics
The Federal Reserve's monetary policy trajectory remains a critical driver for gold prices. Market expectations indicate the Fed is likely to hold rates steady at the January meeting, following recent benign inflation data. However, Goldman Sachs anticipates 50 basis points of rate cuts throughout 2026, which would provide substantial tailwinds for non-yielding assets like gold.
The evolving debate around Federal Reserve independence, following President Trump's public criticism of Fed Chair Jerome Powell and a criminal probe into his leadership, has amplified safe-haven demand for gold. This institutional uncertainty creates a persistent bid under gold prices, as markets price in potential policy risks.
Geopolitical Risk Premium
Gold's rally has been significantly amplified by escalating geopolitical tensions:
Trump Administration Policy Uncertainty: President Trump's threats of tariffs on NATO allies (starting at 10% in February and potentially reaching 25% by June), combined with proposals regarding Greenland annexation, have created substantial policy uncertainty. While some tariff threats were temporarily walked back after diplomatic meetings, the underlying volatility remains.
European Response: The European Parliament suspended ratification of the U.S. trade deal following Trump's tariff announcements, indicating potential for prolonged trade tensions.
Dollar Weakness: The U.S. Dollar Index (DXY) declined to 99.02, retreating from 99.39, which has provided additional support for dollar-denominated gold by making it more attractive to international buyers.
Central Bank Demand
Emerging market central banks continue their strategic diversification into gold as a reserve asset. Goldman Sachs projects central bank purchases will average approximately 60 tonnes monthly throughout 2026, maintaining robust institutional demand. This persistent buying from sovereign entities provides a fundamental floor for gold prices, independent of speculative flows.
ETF Flows and Investment Demand
Western Exchange-Traded Fund (ETF) holdings are expected to increase substantially in 2026 as investors seek portfolio diversification and inflation protection. The combination of anticipated Fed rate cuts and geopolitical uncertainty is driving institutional and retail capital into gold-backed instruments, creating sustained buying pressure.
Wave Pattern and Cycle Analysis
Elliott Wave Structure
Technical analysis using Elliott Wave principles suggests gold is likely within a powerful impulse wave higher. The presumption is that the asset will continue rising toward the $5,100-5,500 range, with potential extensions to $5,545. The critical level of $4,517.65 mentioned in Elliott Wave analysis serves as an important structural pivot, though more recent support has established near $4,400-4,600.
Measured Move Projections
Analysis of previous impulse waves reveals a consistent pattern of approximately $1,000 gains per impulse leg (July-October and mid-October-January 2026). If this pattern maintains, and assuming a 1:1 correction structure of roughly $500, a potential pullback toward $4,400 could precede the next $1,000 rally toward Goldman's $5,400 target.
Cycle Timing
The 90-day cycle around January 19, 2026, suggested a potential continuation breakout within the larger macro bullish phase. The current consolidation near $4,980 may represent the final accumulation before the next impulse leg higher. The 360-day master cycle anchored to September 28, 2026, continues to support the dominant long-term uptrend.
Scenario Analysis and Probability Assessment
Bullish Continuation Scenario (60% Probability)
Gold maintains support above $4,800, consolidates briefly between $4,850-4,950, then breaks decisively above $5,000 psychological resistance. This scenario leads to price discovery toward $5,100-5,300 in the near term, with potential for $5,400-5,545 over the coming weeks.
Catalysts: Fed rate cut expectations, continued central bank buying, geopolitical tensions escalation, dollar weakness, positive ETF flows.
Consolidation Scenario (30% Probability)
Gold consolidates between $4,600-5,000 for an extended period, allowing momentum indicators to reset while maintaining the broader uptrend structure. This healthy consolidation would build energy for the next major impulse higher, potentially in February-March 2026.
Catalysts: Profit-taking after strong gains, temporary geopolitical de-escalation, neutral economic data, mean reversion dynamics.
Corrective Pullback Scenario (10% Probability)
Gold fails to hold $4,600 support and experiences a deeper correction toward $4,200-4,400 trendline support. This scenario would still maintain the overall bullish structure and provide attractive re-entry opportunities for medium-term bulls.
Catalysts: Fed remaining more hawkish than expected, significant dollar strength, unexpected inflation acceleration, large speculative position liquidation.
Economic Calendar Impact - January 26, 2026
Dallas Fed Manufacturing Survey (10:30 EST): This regional manufacturing indicator provides insights into industrial activity in the Texas region. While not a primary gold driver, significant deviations from expectations could impact dollar strength and indirectly affect XAU/USD.
SCE Public Policy Survey (11:00 EST): The Survey of Consumer Expectations from the New York Fed offers insights into consumer inflation expectations and economic sentiment. Higher inflation expectations typically support gold prices as an inflation hedge.
Given the light economic calendar on January 26, technical factors and momentum are likely to dominate intraday price action, with traders focusing on the $5,000 psychological level.
Risk Management Considerations
Position Sizing
Given the elevated price levels and increased volatility in gold markets, position sizing should be conservative. Risk per trade should not exceed 1-2% of total trading capital. The current market environment favors scaling into positions on pullbacks rather than chasing breakouts at all-time highs.
Volatility Assessment
Gold's annualized volatility has increased significantly during the current rally, with daily ranges exceeding $100-200 in recent sessions. Traders must account for this expanded volatility when setting stop losses and position sizes. Wider stops may be necessary to avoid premature stop-outs in legitimate pullbacks.
Correlation Dynamics
Monitor the U.S. Dollar Index (DXY), U.S. Treasury yields, and equity market volatility (VIX) for confirmation of gold's directional bias. Typical correlations show gold moving inversely to the dollar and positively with uncertainty measures. Any deviation from these relationships may signal changing market dynamics.
Technical Trading Strategies
Strategy 1: Pullback Entry (Recommended)
Wait for a healthy pullback to the $4,850-4,900 support zone, where the confluence of previous resistance-turned-support, short-term moving averages, and psychological round numbers create a high-probability entry. This approach offers superior risk-reward compared to chasing current prices.
Entry: $4,850-4,900
Stop Loss: $4,750 (below key support)
Targets: $5,100 (T1), $5,300 (T2), $5,545 (T3)
Partial Profit Taking: Close 30% at T1, 30% at T2, let 40% run to T3 with trailing stop
Strategy 2: Breakout Confirmation
For more aggressive traders, a confirmed breakout above $5,000 with strong volume and momentum could provide an entry signal for continuation to higher targets.
Entry: Break and close above $5,020
Stop Loss: $4,850
Targets: $5,200 (T1), $5,400 (T2)
Risk-Reward: Approximately 1:2.5
Strategy 3: Range Trading
If gold consolidates between $4,850-5,000, nimble traders can exploit the range by buying near support and selling near resistance, though this approach requires quick reflexes and tight risk management.
Institutional Outlook and Price Targets
Goldman Sachs: Raised end-2026 target to $5,400 from $4,900, citing private diversification flows and central bank demand
UBS: Maintains $5,000 as a sustainable level for 2026, supported by strong structural demand
Forex Forecasters: Weekly targets point to $5,545 following a potential test of $4,675 support
Elliott Wave Analysts: Projecting $5,100-5,500 range as next major targets
Multi-Timeframe Confirmation
Daily Chart: Strongly bullish, with price well above all major moving averages and momentum indicators supporting further upside
Weekly Chart: Constructive breakout structure with room for extension toward $5,500 channel target
Monthly Chart: Historic breakout from multi-year consolidation, suggesting a potential secular bull market in gold with targets extending above $6,000 in 2027
Comparative Analysis - Historical Context
The current gold rally mirrors but exceeds previous major gold bull runs. The 2019-2020 COVID-19 rally saw gold rise from $1,450 to $2,075 (43% gain). The current rally from approximately $2,700 in early 2025 to $4,982 represents an 84% advance, indicating exceptionally strong fundamental drivers.
However, unlike previous rallies driven primarily by monetary policy, the current advance incorporates multiple reinforcing factors: geopolitical instability, monetary policy uncertainty, central bank demand, and portfolio diversification flows. This multi-factor support suggests greater sustainability.
Options Market Implications
Options positioning shows elevated call buying at $5,000 and $5,500 strikes, indicating market participants are positioning for continued upside. Put option interest remains modest below $4,500, suggesting limited hedging demand and broad conviction in the uptrend.
Final Trading Recommendations
Primary Strategy: Accumulate gold on any pullback to $4,850-4,900 with tight stops below $4,750. Target $5,100 initially, then trail stops to capture potential extension to $5,300-5,545.
Position Management: Scale into positions rather than committing full size immediately. Take partial profits at predefined targets and use trailing stops once positions move substantially in profit.
Risk Parameters: Maintain strict adherence to stop losses. A close below $4,750 would damage the near-term bullish structure and warrant defensive positioning.
Timeframe: Expect the move to $5,100-5,300 to materialize within 5-10 trading days under the bullish scenario.
Market Regime: Recognize that gold is in a powerful trending environment where pullbacks should be viewed as buying opportunities rather than trend reversals, unless support breaks decisively.
Conclusion
The XAU/USD technical and fundamental landscape strongly favors continued upside toward $5,100-5,545 in the near term, with institutional targets extending to $5,400 by year-end 2026. The combination of Fed rate cut expectations, geopolitical tensions, central bank demand, and technical momentum creates a compelling bullish case.
However, traders must respect the elevated volatility environment and avoid over-leveraging at current extended levels. The preferred approach is to wait for healthy pullbacks to $4,850-4,900 support zone, which offers favorable risk-reward for long positions. Maintaining disciplined risk management with appropriate stop losses below $4,750 remains essential.
The probability-weighted outlook favors bulls, with a 60% likelihood of continuation higher, 30% chance of extended consolidation, and only 10% probability of meaningful correction. This distribution supports a constructive long bias while respecting potential for temporary setbacks in an overheated market.
For January 26, 2026, traders should monitor price action around the $4,950-5,000 zone for breakout confirmation or wait patiently for pullback entries near $4,850. The light economic calendar suggests technical factors will dominate, with the $5,000 psychological level serving as the key near-term battlefield between bulls and bears.
Comments ()