XAU/USD Deep Analysis & Trading Signals for January 23, 2026
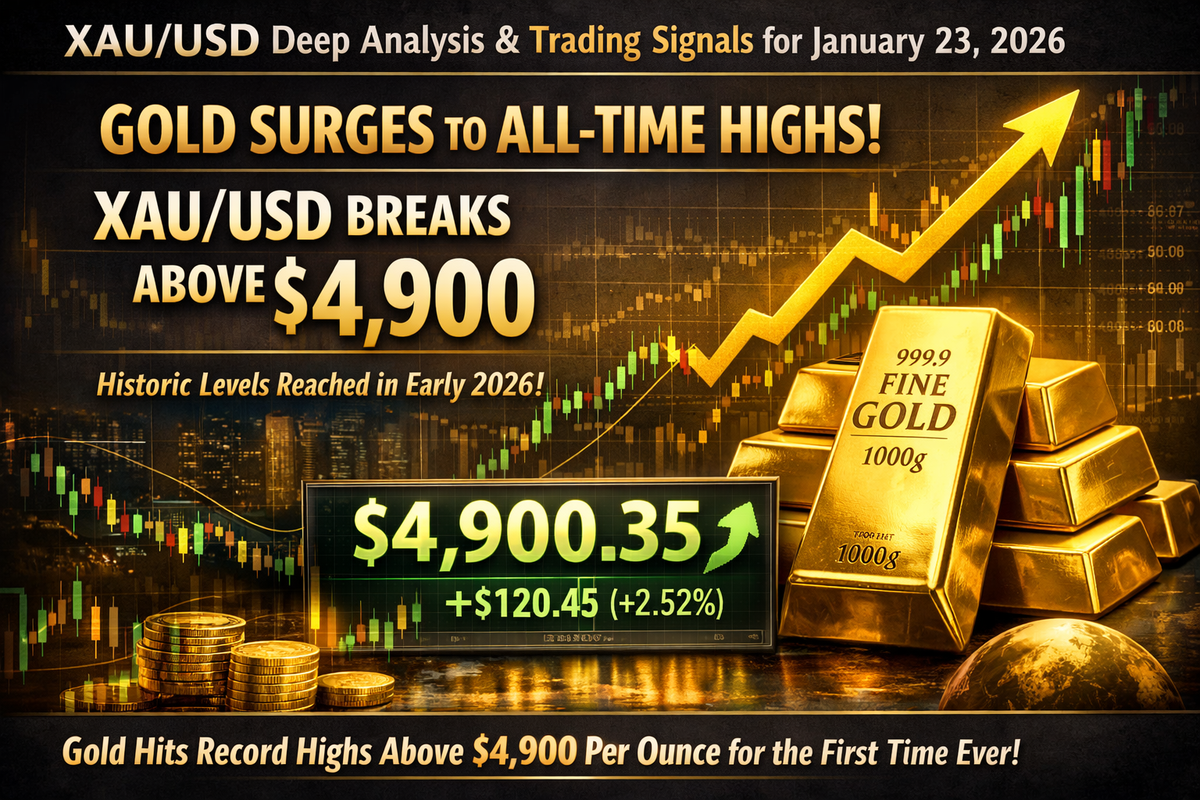
Gold has reached unprecedented territory in early 2026, with XAU/USD surging past $4,900 per ounce for the first time in history. As of January 22, 2026, spot gold closed at $4,917.30, representing a remarkable 78.07% year-over-year increase and a 9.38% gain over the past month alone. This exceptional rally reflects a confluence of technical momentum, fundamental drivers, and structural shifts in global monetary dynamics that warrant detailed examination.
Current Market Overview
The yellow metal ended the trading session on January 22 at $4,917.30 per ounce, up 2.87% from $4,780.30 on January 21. Gold futures for February delivery settled at $4,831.80, demonstrating sustained buying pressure across both spot and futures markets. Historical data reveals a consistent upward trajectory throughout January, with prices climbing from approximately $4,331 at the start of the month.
Technical Analysis Framework
Price Action and Trend Structure
XAU/USD continues to trade within a well-defined bullish channel that has remained intact since late 2025. The asset has established a series of higher highs and higher lows, confirming the strength of the primary uptrend. Moving averages across multiple timeframes indicate robust buying pressure, with prices trading significantly above the 50-day simple moving average at approximately $4,068.70 and the 100-day SMA at $4,069.90.
The current price structure shows gold consolidating near record highs, with recent corrections proving shallow and quickly absorbed by buyers—a classic characteristic of strong bull markets where demand consistently outweighs supply.
Critical Support Levels
Primary Support Zone: $4,680 - $4,641
This represents the most critical support cluster for maintaining the current bullish structure. The $4,680 level has emerged as the lower boundary of the recent consolidation pattern, while $4,641 marks the edge of the 1:1 geometry that has governed the recent rally. A sustained hold above this zone confirms continuation of the uptrend.
Secondary Support: $4,560 - $4,445
Analysis of the broader technical structure identifies $4,560 as an intermediate support level that previously acted as resistance. Further down, $4,445 represents a key retracement level where buyers would likely step in aggressively to defend the trend.
Major Support: $4,385 - $4,330
The $4,385 level corresponds to a significant Fibonacci retracement and represents the support area where a bearish correction scenario would find substantial buying interest. Below this, $4,330 marks the monthly low and would constitute a deeper retracement that could signal a short-term trend reversal.
Key Resistance Levels
Immediate Resistance: $4,991 - $5,000
The psychological $5,000 level represents the next major target for the current rally. Technical analysis using Fibonacci extensions places the 265.8% extension of the January 8-15 rally at $4,991, creating a natural resistance cluster in this zone. A breakout above $5,000 would likely trigger substantial momentum-driven buying and stop-loss orders from short positions.
Extended Targets: $5,235 - $5,400
Weekly forecasts suggest that sustained upward momentum could drive prices toward $5,235 in the near term. Goldman Sachs has revised its 2026 year-end target to $5,400 per ounce, up from a previous $4,900 forecast, based on continued private-sector diversification and central bank buying.
Long-term Projection: $6,000
J.P. Morgan Global Research identifies $6,000 per ounce as a longer-term possibility, representing an extension of the structural bull market driven by monetary debasement concerns and portfolio diversification trends.
Technical Indicators Analysis
Relative Strength Index (RSI)
Current RSI readings show the asset hovering near neutral-to-bullish territory, with room for further upside before reaching overbought conditions. The 4-hour chart RSI at approximately 44.99 suggests that recent corrections have reset short-term momentum without breaking the larger bullish structure. Analysis of RSI divergence patterns indicates that buyers continue to accumulate positions during pullbacks, supporting the continuation thesis.
MACD (Moving Average Convergence Divergence)
The MACD indicator has exhibited positive crossovers on both daily and weekly timeframes, confirming the strength of the uptrend. The histogram shows expanding bullish momentum, with the signal line maintaining positive territory. Recent price action demonstrates that the MACD remains supportive of higher prices, with accumulation patterns visible during consolidation phases.
Moving Averages
The 50-day SMA currently provides dynamic support around $4,068, while the 100-day SMA sits at $4,069.90, creating a strong supportive cluster. The 200-day moving average, though not explicitly stated in current data, would be positioned significantly lower, underscoring the magnitude of the current rally. The golden cross formation—where shorter-term moving averages cross above longer-term ones—remains firmly in place, a classic bullish signal.
Fibonacci Retracement Analysis
Fibonacci analysis of the recent rally reveals critical levels that have governed price behavior. The 61.8% Fibonacci retracement from the high of $4,888 to the January 22 low around $4,768 occurs near $4,794, a level where gold found support during the most recent correction. Key Fibonacci extension levels project upside targets at $4,991 (265.8% extension) and beyond $5,000, confirming the technical validity of these resistance zones.
Average True Range (ATR)
The 14-period ATR currently measures approximately 18.8, indicating elevated volatility and daily price swings averaging around $19. This elevated volatility reflects the intense interest in the gold market and suggests that substantial intraday movements will continue, creating opportunities for both position traders and day traders.
Fundamental Analysis
Federal Reserve Policy and Interest Rate Environment
The Federal Reserve's monetary policy stance remains a primary driver of gold prices. Goldman Sachs projects that the Fed will implement a 50-basis-point rate cut during 2026, with the Fed Funds rate expected to decline from current levels. The Fed's own inflation forecast projects a rate of 2.4% by the end of 2026, down from 2.6% in September 2025, with a return to the 2% target not expected until 2028.
This persistent inflation environment, combined with declining nominal interest rates, keeps real yields relatively low—a highly constructive scenario for non-yielding assets like gold. The upcoming Federal Reserve meeting scheduled for January 27-28, 2026, represents a critical event risk, with the policy decision due at 2:00 p.m. ET on Wednesday, January 28, followed by Chair Powell's press conference at 2:30 p.m. ET.
Central Bank Demand: A Structural Support Factor
Central bank gold purchases have emerged as one of the most significant structural support factors for prices. Survey data from the World Gold Council indicates that 95% of central banks plan to increase their gold reserves during 2026. This unprecedented level of institutional demand provides a firm floor under prices and limits downside potential.
Goldman Sachs projects average central bank purchases of approximately 60 tonnes per month in 2026 as emerging market central banks continue diversifying away from U.S. dollar reserves. This trend reflects concerns about geopolitical fragmentation and U.S. fiscal sustainability, creating persistent buying pressure that absorbs supply and supports prices during consolidation periods.
Third-quarter 2025 data showed central banks purchased 220 tonnes of gold, up nearly 30% from the second quarter, with emerging markets leading the buying. This acceleration has continued into 2026, contributing to the relentless bid under gold prices.
ETF Flows and Investment Demand
Gold-backed exchange-traded funds (ETFs) have played a renewed and significant role in the 2025-2026 rally. After two years of outflows, gold ETFs recorded their strongest inflows since 2020, with holdings rising by more than 220 tonnes during 2025. The third quarter of 2025 alone saw ETF investors add 222 tonnes, marking the biggest quarterly inflow in years and taking global holdings within reach of their November 2020 all-time high.
Goldman Sachs expects Western ETF holdings to continue rising as the U.S. Federal Reserve proceeds with rate cuts, noting that ETF buying is typically closely linked to Fed policy. The assumption that private sector diversification buyers will not liquidate their gold holdings in 2026 has effectively lifted the baseline for price forecasts, reflecting a structural shift in portfolio allocation strategies.
U.S. Dollar Dynamics
The U.S. Dollar Index (DXY) trades at approximately 99.09 as of January 19, 2026, having declined 0.31% in recent sessions. Over the past 12 months, the dollar has weakened by 9.38%, providing significant tailwind support for dollar-denominated gold prices. This inverse relationship between the dollar and gold remains a critical dynamic, with continued dollar weakness likely to accelerate gold's advance.
A sustained bounce in the DXY toward the 99.50-100.00 zone could create temporary headwinds for gold, potentially driving prices back toward the $4,610-$4,640 support area. Conversely, renewed dollar weakness below 98.50 would likely propel gold toward the $4,750-$4,800 region and beyond. The dollar's trajectory will be heavily influenced by Fed policy communications and relative economic performance versus other major economies.
Geopolitical Risk Premium
Geopolitical tensions have provided substantial safe-haven demand for gold throughout the recent rally. U.S. President Donald Trump's comments regarding Greenland and broader geopolitical uncertainties have contributed to elevated risk premiums. While Trump's subsequent moderation of rhetoric on January 22 led to a brief pullback in prices, the underlying geopolitical landscape remains fraught with uncertainty.
Market participants continue to favor gold as a hedge against global policy risks, including concerns about central bank independence following the Trump administration's repeated criticisms of the Federal Reserve. This "debasement trade" reflects investor anxiety about the long-term direction of global monetary policy and the sustainability of government debt levels.
Supply and Demand Fundamentals
Jewelry demand has declined for six consecutive quarters on a year-over-year basis as record prices curb consumption, with Q3 2025 seeing a 19% decrease to 371 tonnes. However, in value terms, spending on jewelry rose 13% to $41 billion, as higher prices offset weaker volumes. This dynamic reflects the price-inelastic nature of investment and central bank demand, which has more than compensated for softer jewelry consumption.
Bar and coin demand remained robust at 316 tonnes in Q3 2025, demonstrating sustained retail investor interest despite elevated price levels. Total gold demand continues to exceed supply at current price points, supporting the bullish thesis for continued price appreciation.
Trading Signals and Strategies
Primary Bullish Signal (High Probability)
Entry Strategy: Buy on dips toward the $4,680-$4,700 support zone
Target 1: $4,991 (Fibonacci extension level)
Target 2: $5,235 (weekly forecast target)
Target 3: $5,400 (Goldman Sachs year-end target)
Stop Loss: $4,640 (below key support cluster)
Risk-Reward Ratio: Approximately 1:5 to primary target
Rationale: The primary trend remains strongly bullish, with multiple fundamental drivers supporting higher prices. Buying on pullbacks to key support levels offers favorable risk-reward profiles. The base scenario assumes continuation of the uptrend as long as gold holds above the $4,641-$4,680 support zone.
Secondary Bullish Signal (Breakout Strategy)
Entry Strategy: Buy on confirmed breakout above $5,000 with strong volume
Target 1: $5,235
Target 2: $5,400
Target 3: $5,700 (extension target)
Stop Loss: $4,920 (below recent consolidation)
Risk-Reward Ratio: Approximately 1:3 to first target
Rationale: A decisive breakout above the psychological $5,000 level would likely trigger momentum-driven buying and create a new phase of price discovery. This strategy capitalizes on continuation momentum after a period of consolidation near all-time highs.
Conservative Bearish Signal (Corrective Scenario)
Entry Strategy: Sell from resistance near $4,845-$4,880
Target 1: $4,765 (21 SMA and 61.8% Fibonacci level)
Target 2: $4,680 (primary support)
Target 3: $4,560 (secondary support)
Stop Loss: $4,920 (above recent high)
Risk-Reward Ratio: Approximately 1:2 to first target
Rationale: Short-term traders may attempt to fade strength into resistance levels, anticipating technical corrections within the broader uptrend. This strategy carries higher risk given the strong primary trend and should only be employed with tight risk management. The trade would be invalidated on a clear break above $4,920-$4,950.
Aggressive Bearish Signal (Trend Reversal Scenario)
Entry Strategy: Sell on confirmed break below $4,445 with increasing volume
Target 1: $4,385 (weekly support level)
Target 2: $4,330 (monthly low)
Target 3: $4,290 (extended support)
Stop Loss: $4,520
Risk-Reward Ratio: Approximately 1:2
Rationale: A breakdown below $4,445 would signal a potential trend change and could trigger a deeper correction toward $3,785. However, this scenario is considered low probability given current fundamental support from central banks and ETF flows. This signal should only be considered if accompanied by a significant shift in fundamental drivers, such as unexpectedly hawkish Fed policy or resolution of major geopolitical risks.
Range Trading Strategy (Current Environment)
Buy Zone: $4,740-$4,770
Sell Zone: $4,880-$4,920
Neutral Zone: $4,770-$4,880
Stop Loss (Long): $4,710
Stop Loss (Short): $4,950
Rationale: For traders seeking to capitalize on near-term volatility within the established trend, range trading between defined support and resistance levels can generate consistent returns. The ATR of 18.8 indicates sufficient intraday movement to justify this approach.
Risk Factors and Alternative Scenarios
Downside Risks
Fed Policy Surprise: An unexpectedly hawkish stance from the Federal Reserve, including higher-than-anticipated terminal interest rate projections or an acceleration of quantitative tightening, could strengthen the dollar and pressure gold prices. The January 28 FOMC meeting represents a key event risk.
Geopolitical De-escalation: A significant reduction in perceived global policy risks could prompt liquidation of macro policy hedges, as Goldman Sachs has warned. If major geopolitical tensions ease substantially, the safe-haven premium could compress rapidly.
Technical Breakdown: A confirmed break below $4,445 with strong selling volume would invalidate the bullish structure and could trigger a cascade of stop-loss orders, potentially driving prices toward $4,330 or lower.
Central Bank Policy Shift: While considered unlikely, a coordinated reduction in central bank gold purchases would remove a critical structural support factor and could lead to significant price adjustments.
Upside Catalysts
Accelerated Fed Easing: If inflation proves more stubborn than expected and the Fed is forced to cut rates more aggressively to support economic growth, real yields could fall faster than currently anticipated, providing additional fuel for gold's rally.
Dollar Crisis: Concerns about U.S. fiscal sustainability or a loss of confidence in dollar reserve status could trigger a flight to gold as an alternative monetary asset. The "debasement trade" could intensify significantly under such a scenario.
Geopolitical Escalation: A major geopolitical crisis, including military conflicts or severe trade tensions, would likely drive safe-haven flows into gold, potentially pushing prices well above $6,000 per ounce.
Supply Disruptions: Any significant disruptions to gold mining or refining operations could tighten physical markets and support higher prices.
Market Sentiment and Positioning
Current market sentiment reflects a "fear of missing out" dynamic, with analysts noting that the perfect storm of geopolitical uncertainty, monetary policy accommodation, and structural demand shifts has created an environment highly conducive to continued gold appreciation. However, this sentiment also suggests that markets may be vulnerable to sharp corrections if any of the key supporting narratives weaken.
Institutional positioning data shows that long positions in gold futures and options remain elevated, though not at extreme levels that would signal imminent exhaustion. The steady accumulation by central banks and ETFs provides a more sustainable foundation than speculative positioning alone would offer.
Trading Session Outlook for January 23, 2026
For the January 23 trading session specifically, several factors will influence price action:
Near-term Technical Setup: Gold is consolidating just below the $4,920-$4,930 zone after reaching an intraday high of $4,928.51 on January 22. The immediate bias favors a test of the $4,950-$5,000 resistance zone, particularly if the dollar continues to show weakness.
Volatility Expectations: With ATR at 18.8, traders should anticipate daily ranges of $15-$25, creating opportunities for both directional and range-bound strategies.
Key Price Levels for January 23:
- Bullish Above: $4,900 - continuation toward $4,950-$5,000
- Neutral Range: $4,850-$4,900
- Bearish Below: $4,850 - potential retest of $4,765-$4,800 support
Intraday Strategy: Given the strong underlying trend, the preferred approach is to look for buying opportunities on any dips toward $4,850-$4,870, with upside targets at $4,950 and $5,000. Short-term resistance at $4,920-$4,930 may provide temporary obstacles, but a breakout above this level would likely accelerate gains.
Professional Risk Management Guidelines
Regardless of which trading signals are employed, strict risk management protocols are essential when trading XAU/USD at current elevated levels:
Position Sizing: Risk no more than 1-2% of trading capital on any single trade, given the elevated volatility environment.
Stop Losses: Always use stop-loss orders and respect them. The volatile nature of gold markets can lead to rapid reversals that quickly erode profits or magnify losses.
Profit Taking: Consider taking partial profits at predetermined levels rather than holding entire positions for maximum targets. This locks in gains and reduces emotional decision-making.
Correlation Monitoring: Closely monitor the U.S. Dollar Index, Treasury yields, and equity market performance, as these assets exhibit significant correlations with gold that can provide early warning signals.
Event Risk: Be aware of scheduled economic data releases and Fed communications that could trigger sharp price movements. The January 28 FOMC meeting represents a major event risk that may warrant reduced position sizes or protective strategies.
Conclusion
XAU/USD stands at a historic juncture, with prices consolidating near all-time highs above $4,900 per ounce. The technical structure remains robustly bullish, with critical support at $4,680-$4,641 defining the lower boundary of the current trend channel. Multiple fundamental drivers—including anticipated Fed rate cuts, unprecedented central bank buying, record ETF inflows, dollar weakness, and persistent geopolitical uncertainties—provide strong support for continued price appreciation.
The base case scenario projects further gains toward the $4,991-$5,000 psychological resistance zone in the near term, with extended targets at $5,235 and Goldman Sachs' revised year-end forecast of $5,400. Longer-term projections from major institutions suggest $6,000 per ounce remains a realistic possibility as structural portfolio diversification trends continue.
For January 23, 2026, the tactical outlook favors buying on dips toward $4,850-$4,870, with initial upside targets at $4,950-$5,000. The primary trend remains firmly bullish as long as gold maintains support above $4,680, though traders should remain cognizant of elevated volatility and event risks, particularly the upcoming January 28 FOMC meeting.
The convergence of technical momentum, fundamental catalysts, and structural demand shifts creates a compelling case for continued strength in gold prices. However, disciplined risk management remains paramount, as the elevated price levels and substantial year-to-date gains leave the market vulnerable to sharp corrections should any of the key supporting narratives weaken unexpectedly.
Disclaimer: This analysis is for educational purposes only and does not constitute financial advice. Trading precious metals involves substantial risk of loss and is not suitable for all investors. Past performance is not indicative of future results. Always conduct your own research and consult with qualified financial professionals before making investment decisions.
Comments ()