Why Gold Moves: Real Drivers (USD, Yields, Risk Sentiment)
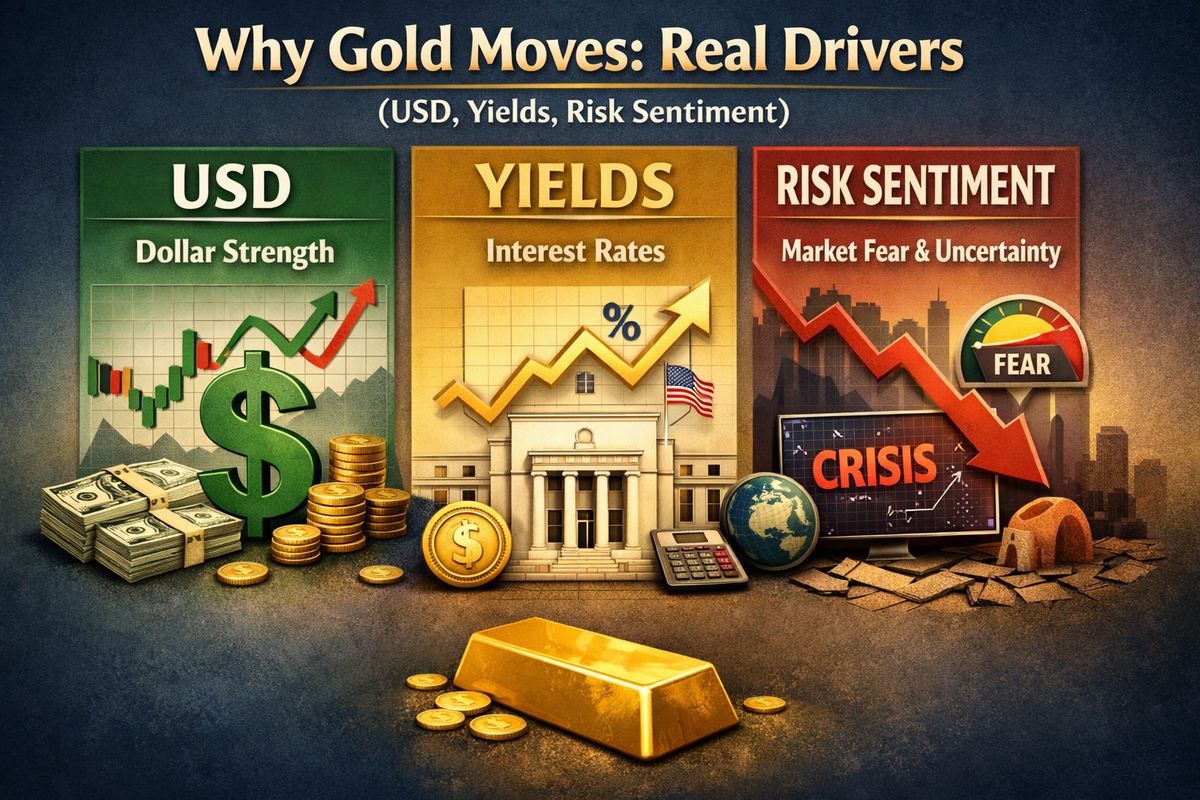
Gold often appears mystical to traders—surging during crises, falling when stocks rally, sometimes defying logic entirely. But strip away the narrative, and gold's price movements are driven by specific, measurable forces: the value of the U.S. dollar, real interest rates, and shifts in risk appetite. Understanding these fundamental relationships transforms gold from a speculative bet into a tradable asset with predictable behavioral patterns across different market regimes.
The USD-Gold Inverse Relationship: Why the Dollar Matters
The most fundamental relationship in gold trading is its inverse correlation with the U.S. Dollar Index (DXY). Because gold is priced globally in U.S. dollars, changes in dollar strength directly affect gold's purchasing power and international demand.
The mechanics of the inverse relationship
Phillip Nova explains the core dynamic: when the dollar strengthens, gold often retreats, and when the dollar weakens, gold tends to rally. This inverse movement operates through several channels:
- International purchasing power: A stronger USD means buyers outside the United States need more of their home currency to purchase an ounce of gold, dampening demand and pulling prices down.
- Opportunity cost: When the dollar is strong and expected to appreciate, holding a non-yielding asset like gold becomes less attractive relative to dollar-denominated cash or bonds.
- Reserve diversification: Central banks and sovereign wealth funds often diversify away from dollar assets into gold when they perceive dollar weakness or devaluation risk.
Concrete examples illustrate the power of this relationship. In 2022, aggressive Federal Reserve interest rate hikes sent the DXY to two-decade highs, and during that period gold lost appeal as USD-denominated prices climbed, demonstrating how a booming dollar reduces gold's attractiveness. More recently, in early 2025, the dollar index fell dramatically—down approximately 10.8% in the first half of the year—as investors sold USD amid global policy concerns; simultaneously, gold hit new record highs on sustained buying by central banks worried about dollar devaluation.
How strong is the correlation?
Recent data from 2025 shows the 60-day rolling correlation between gold and the DXY hovering around -0.45, indicating a moderately strong inverse relationship. While this negative correlation has held since mid-May 2022, it has shown more volatility in 2025 than in previous years, swinging from -0.72 to just above zero before settling around -0.44.
CME Group notes that the traditional inverse relationship between gold and the U.S. dollar appears to reassert itself under certain market conditions, particularly as the Federal Reserve transitions from tightening to potential easing. However, heightened global uncertainties—including trade disputes and geopolitical conflicts—can drive simultaneous demand for both gold and the dollar when they are both perceived as safe-haven assets, potentially disrupting the historical inverse correlation.
This means traders cannot rely blindly on the USD-gold inverse relationship; context matters. During extreme risk-off environments, both can rise together as safe havens. During reflation trades or dollar debasement fears, gold may surge even as the dollar remains resilient if other factors (yields, inflation expectations) dominate.
Real Yields: The Most Powerful Gold Driver
While the dollar relationship is important, many analysts consider real interest rates (nominal yields minus inflation expectations) to be the single most powerful driver of gold prices.
Understanding the real yield relationship
LongtermTrends documents that the correlation between real interest rates and the price of gold is approximately -0.82—a very strong inverse relationship. Their analysis, which plots the price of one ounce of gold against the expected real 10-year inflation-adjusted interest rate, shows clearly that when real yields decline, gold rises, and vice versa.
PIMCO's quantitative research reinforces this finding. Their regression of real gold prices against 10-year real yields from 2004 to 2025 shows that a 100-basis-point increase in 10-year real yields has historically led to an 18% decline in the inflation-adjusted price of gold. In technical terms, gold has a "real duration" of 18 years—meaning it behaves, from a sensitivity standpoint, like an 18-year duration bond with respect to real rate changes.
Why real yields matter so much
The economic logic is straightforward:
- Opportunity cost of holding gold: Gold pays no dividends or interest. When real yields are high, the opportunity cost of holding gold instead of interest-bearing assets becomes substantial. Rational investors demand higher returns elsewhere, reducing gold demand.
- Negative real yields favor gold: When real yields turn negative (meaning bond holders lose purchasing power after accounting for inflation), holders of cash and bonds are losing wealth. In such scenarios, gold becomes more attractive as a store of value that maintains purchasing power.
- Inflation expectations embedded: Real yields incorporate market expectations for future inflation via breakeven rates. When breakeven inflation rises (indicating higher inflation expectations), real yields fall if nominal yields don't rise proportionally, boosting gold.
Recent market behavior confirms the relationship. Gold as a non-interest-bearing asset loses appeal when economic data—such as strong U.S. Initial Jobless Claims—reinforces expectations that the Federal Reserve will keep interest rates elevated for longer. Conversely, anticipation of Fed rate cuts (which would lower nominal yields and potentially reduce real yields) has supported gold rallies.
The post-2022 disconnect and structural shifts
An interesting development has emerged in recent years. Despite the tightening of monetary policies globally—characterized by higher interest rates aimed at curbing inflation—demand for gold has remained robust, leading to a partial disconnection between real global interest rates and gold prices. Central bank purchases have continued at record levels even as real yields rose, suggesting that structural demand (reserve diversification, geopolitical hedging) has offset some of the traditional rate sensitivity.
This doesn't invalidate the real yield relationship; rather, it suggests that other factors (particularly central bank buying and geopolitical risk) have provided a structural bid that has cushioned gold against what would normally be headwinds from rising real rates.
Risk Sentiment and Safe-Haven Flows
Gold's role as a safe-haven asset means its price is heavily influenced by shifts in market risk appetite and geopolitical uncertainty.
How risk sentiment affects gold
FXStreet notes that gold has an inverse correlation with risk assets: a rally in the stock market tends to weaken gold prices, while sell-offs in riskier markets tend to favor the precious metal. During risk-on environments—when investors are optimistic and willing to take on more risk—capital flows away from safe havens like gold and into equities, credit, and emerging markets. Conversely, when risk appetite deteriorates, gold benefits from defensive positioning.
Recent examples illustrate this dynamic clearly. In January 2026, gold moved below $4,600 as safe-haven demand eased when geopolitical risks in Iran temporarily subsided. U.S. President Donald Trump signaled he might delay military action after Iran pledged not to execute protesters, and market sentiment improved, reducing the urgency of holding defensive assets.
Conversely, when geopolitical tensions escalate, gold receives an immediate boost. Pepperstone's analysis from early January 2026 noted that rising geopolitical tensions in Latin America (specifically U.S. actions in Venezuela) provided a short-term boost for gold bulls, with safe-haven demand pushing prices higher. Similarly, Investing.com observed that ongoing uncertainty kept safe-haven demand firm, allowing gold and silver to consolidate near elevated levels rather than reversing sharply.
Duration and sustainability of risk-driven moves
An important distinction for traders: not all safe-haven rallies are equal. The duration of geopolitical risk impacts on gold prices varies significantly depending on whether tensions escalate or resolve quickly.
Pepperstone's analysis points out that historical experience shows market reactions to sudden geopolitical events are often brief. For example, on June 22, 2025, the U.S. carried out a weekend airstrike on Iran; gold opened the following Monday with only a 0.02% gain and closed the week down 2.8%. This suggests that unless critical infrastructure is materially damaged or conflicts escalate into sustained uncertainty, safe-haven demand triggered by isolated events may prove short-lived.
However, tail risks from ongoing geopolitical tensions should not be ignored. Regional conflicts can influence broader international relations and potentially affect the global political landscape, offering ongoing support for gold even after initial price spikes fade.
The dual safe-haven problem
One complexity traders face is that both the U.S. dollar and gold are considered safe-haven assets. During certain crises—particularly those involving concerns about non-U.S. assets or emerging market instability—the dollar and gold can rise together, breaking the typical inverse correlation.
CME Group emphasizes that heightened global uncertainties, including trade disputes and geopolitical conflicts, can drive simultaneous demand for both gold and the dollar when they are viewed as complementary safe havens rather than substitutes. This dual safe-haven dynamic can create confusing price action where gold doesn't fall despite dollar strength, or doesn't rally as much as expected when the dollar weakens.
Central Bank Demand: The Structural Bid
A critical development in gold markets over the past several years has been the surge in central bank gold purchases, which has provided a structural floor under prices regardless of short-term fluctuations in dollar strength or yields.
The scale of central bank buying
The numbers are striking. From 2022 to 2024, net central bank gold purchases more than doubled, surpassing 1,000 tonnes annually. In Q3 2025 alone, central banks purchased 220 tonnes of gold, representing a 10% increase year-on-year and a 28% increase from the prior quarter. Year-to-date through November 2025, central bank net purchases totaled 297 tonnes, with buying momentum continuing into late 2025.
World Finance reported that central banks added 410 tonnes of gold in the first half of 2025, 24% above the five-year average. J.P. Morgan analysts believe central bank demand will remain elevated, noting they were encouraged by strong buying in Q3 2025 even with gold at record prices.
Why central banks are buying
Several factors explain the renewed momentum in official-sector gold accumulation:
- Strategic reserve diversification: Central banks are reducing their reliance on USD-denominated assets to offset currency, inflation, and geopolitical risk. This reflects concerns about U.S. fiscal sustainability, dollar weaponization via sanctions, and desire for politically neutral reserves.
- Price-insensitive buying: Unlike retail or investment buyers, central banks act on long-term strategic goals rather than short-term price considerations. Elevated prices have not deterred central bank purchases, which continue to provide price support.
- Emerging market leadership: The surge has been primarily driven by central banks in Asia (including China, India, and Japan) and emerging markets more broadly.
Surveys indicate that 95% of central banks expect to increase gold reserves in 2026, with Poland, Brazil, and China continuing to dominate purchases. Notably, about two-thirds of Q3 official-sector gold purchases came from central banks that do not publicly report their buying activity, continuing a trend of non-transparent accumulation.
Market implications
For traders and investors, central bank buying creates several important dynamics:
- Structural demand base: Official-sector accumulation offers a consistent demand component that is unlikely to be withdrawn quickly, limiting downside risk.
- Price support during corrections: Central banks tend to be counter-cyclical buyers, often increasing purchases when prices dip, which can put a floor under selloffs.
- Reduced sensitivity to traditional drivers: The scale of central bank buying has partially disconnected gold from its traditional relationships with real yields and the dollar, as seen in 2022-2024 when gold held up despite rising rates.
Inflation Expectations and Gold as a Hedge
Gold's reputation as an inflation hedge is deeply embedded in investor psychology, but the actual relationship is more nuanced than commonly believed.
Gold and inflation: theory and evidence
Theoretically, a rise in expected inflation should drive investors to acquire gold either as a hedge against anticipated currency depreciation or as a speculative move expecting gold prices to rise. This heightened demand subsequently drives up gold prices during periods of rising inflation expectations.
Academic research shows that gold's effectiveness as an inflation hedge depends on the timeframe and economic conditions. Studies using Markov-switching error correction models found that gold partially hedges future inflation over the long term, with stronger hedging ability in the U.S. and UK compared to Japan and the Euro Area. The effectiveness is significantly influenced by whether markets are in "normal" or "turbulent" regimes, with gold performing better as an inflation hedge during crisis periods.
Breakeven inflation and real yields
The mechanism connecting inflation expectations to gold operates primarily through real yields. Breakeven inflation rates—the rates of future inflation that would equate the yield of nominal bonds to TIPS (Treasury Inflation-Protected Securities)—are positively related to historical inflation, with changes in inflation over the last 12 months being the largest contributor to expected fluctuations.
When breakeven inflation rises (indicating higher expected future inflation), and if nominal yields don't rise by an equal amount, real yields fall, making gold more attractive. This is why gold often rallies not when inflation is rising, but when inflation expectations are rising faster than nominal yields—the real yield decline is the actual trigger.
Recent inflation dynamics
Throughout 2025-2026, inflation hedging demand and concerns about USD credit protection have continued to underpin gold, even as actual inflation rates have moderated from 2022 peaks. Pepperstone notes that medium- to long-term bullish drivers including inflation hedging demand remain intact, supporting gold's structural bid.
Minneapolis Fed President Neel Kashkari's comments that "inflation is still too high but is moving the right way" reflect the ongoing tension between declining but sticky inflation and the Fed's target, a dynamic that keeps inflation expectations and gold-as-hedge narratives relevant.
Putting It All Together: How the Drivers Interact
Understanding each driver in isolation is valuable, but gold's actual price movements reflect the interaction of multiple forces simultaneously.
Dominant factor analysis
In different market regimes, different factors dominate:
- During Fed policy transitions: Real yields typically dominate, with rate cut expectations driving gold higher and rate hike expectations (or delayed cut expectations) weighing on gold.
- During geopolitical crises: Safe-haven flows and risk sentiment can override dollar and yield considerations, at least temporarily.
- During dollar regime shifts: Major swings in the DXY (like the 10.8% drop in H1 2025) can overwhelm other factors and drive sustained gold trends.
- During structural shifts: Central bank buying can provide a floor that prevents gold from falling as much as historical relationships with yields and the dollar would predict.
Example: Recent gold behavior near $4,600
Recent price action around $4,600 in January 2026 illustrates the interplay:
- Gold moved below $4,600 as safe-haven demand eased when geopolitical risks temporarily subsided (risk sentiment factor).
- Simultaneously, strong U.S. jobless claims data reinforced expectations that the Fed would keep rates on hold longer, pushing rate cut expectations from earlier to June (real yields factor).
- These factors overwhelmed any potential support from dollar weakness or ongoing central bank buying in the short term.
Conversely, gold's surge above $4,600 earlier in the period reflected geopolitical escalation in Latin America (safe haven), expectations of Fed easing (yields), and continued central bank accumulation (structural demand).
Practical Implications for Trading and Investment
Understanding gold's fundamental drivers enables more disciplined trading and positioning decisions.
Watch the right indicators
To anticipate gold moves, traders should monitor:
- DXY (U.S. Dollar Index): Track the broader dollar trend and watch for breakouts or breakdowns from consolidation ranges.
- 10-year TIPS real yields: This is arguably the single most important indicator; falling real yields are gold's friend, rising real yields are its enemy.
- Breakeven inflation rates: Rising breakevens signal increasing inflation expectations, which pressure real yields lower if nominal yields don't keep pace.
- VIX and equity market volatility: Rising volatility and equity weakness often trigger safe-haven flows into gold.
- Geopolitical developments: Keep tabs on major geopolitical risks, particularly those involving oil supply, major power conflicts, or financial system stress.
- Central bank announcements: Quarterly and monthly central bank gold purchase data can reveal structural demand trends.
Regime-dependent strategies
Different gold trading strategies suit different environments:
- In rising rate, strong dollar environments: Gold typically faces headwinds; traders might look for short setups or stay on the sidelines.
- In easing cycles with weakening dollar: Gold often enters sustained bull markets; dip-buying and trend-following strategies work well.
- During geopolitical shocks: Gold spikes can be sharp but short-lived unless conflicts escalate; mean-reversion strategies may be appropriate after initial spikes fade.
- In negative real yield regimes: Gold becomes a compelling hold or accumulation asset, as the opportunity cost of holding it is negative.
Don't fight all three factors
A useful heuristic: when all three major factors (dollar, real yields, risk sentiment) align in one direction, gold trends tend to be strong and sustained. When factors are mixed—for example, dollar weak but real yields rising—gold may chop or trend weakly. Fighting a gold move when all three factors are aligned is low-probability trading.
Conclusion: Gold Is Predictable When You Know What to Watch
Gold is not mysterious or irrational. Its price movements reflect concrete, measurable forces: the value of the dollar it's priced in, the opportunity cost of holding it versus interest-bearing alternatives (real yields), and the intensity of defensive demand during uncertainty.
The strongest moves occur when these drivers align: a weakening dollar, falling real yields, and rising risk aversion create powerful tailwinds for gold, while a strengthening dollar, rising real yields, and improving risk appetite create equally strong headwinds. Structural developments—particularly unprecedented central bank buying—have added a bid that can cushion gold during periods when cyclical factors would otherwise weigh on prices.
For traders and investors, the takeaway is simple: stop trading gold based on chart patterns alone, and start tracking the fundamental drivers that actually move the metal. Watch the DXY, monitor real yields via TIPS breakevens, pay attention to risk sentiment shifts, and respect the structural bid from official-sector buying. When you understand why gold moves, it stops being a gamble and becomes a strategic position based on observable, tradable drivers.
Comments ()