Retail Indicators vs Institutional Context: What Pros Actually Use
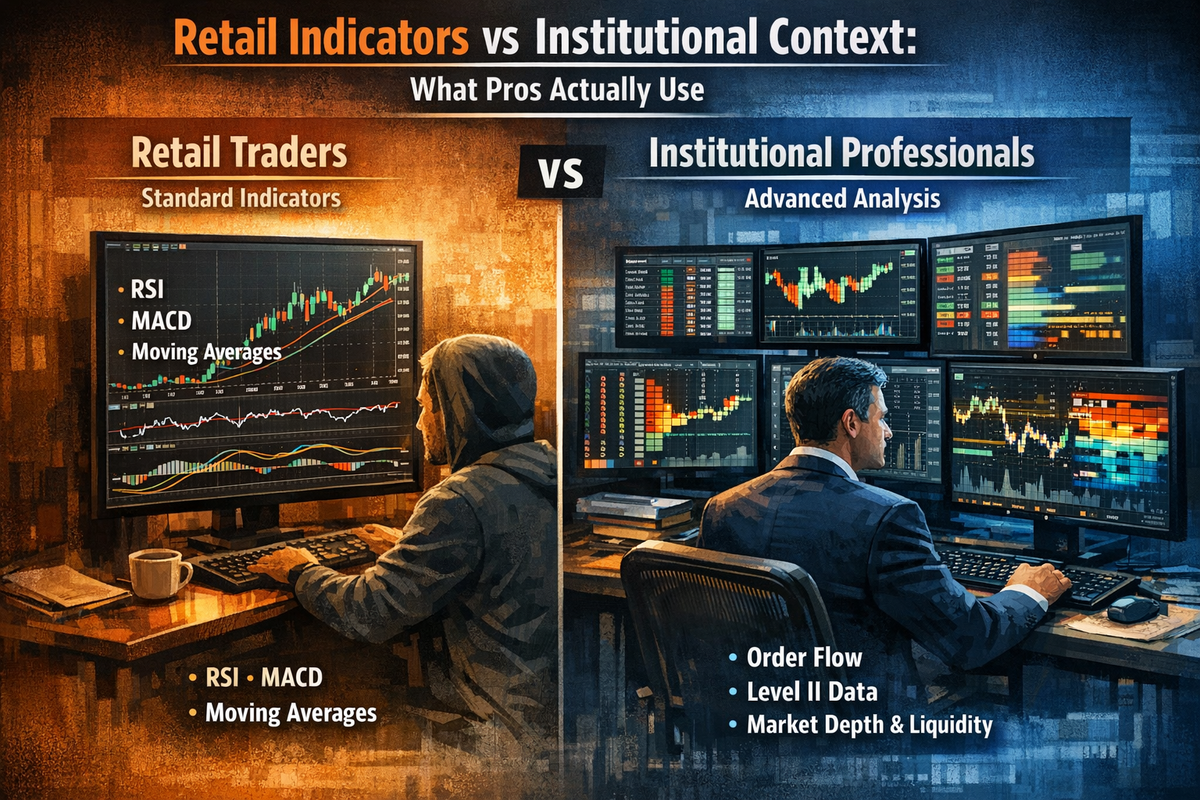
The trading world operates on two distinct levels: retail traders working with standard technical indicators, and institutional professionals employing sophisticated market microstructure analysis. While retail traders typically rely on indicators like RSI, MACD, and moving averages to make trading decisions, institutional traders focus on order flow, volume analysis, market depth, and proprietary tools that reveal the actual mechanics of price movement. Understanding this fundamental difference is crucial for traders seeking to elevate their approach from surface-level signals to actionable market intelligence.
The Retail Indicator Framework
Popular Retail Tools and Their Applications
Retail traders predominantly use lagging indicators that analyze historical price data to generate trading signals. The three most widely adopted tools are the Relative Strength Index (RSI), Moving Average Convergence Divergence (MACD), and various moving averages. These indicators have become standard fixtures on retail trading platforms precisely because they offer straightforward visual signals that appear easy to interpret.
The RSI measures momentum by comparing the magnitude of recent gains to recent losses on a scale of 0 to 100. Traditional interpretations suggest that readings above 70 indicate overbought conditions while readings below 30 signal oversold states. Research examining the effectiveness of RSI across various markets has shown accuracy rates ranging from 44% to 97%, depending on market conditions and implementation. These wide-ranging results highlight a critical issue: retail indicators perform inconsistently across different market environments.
MACD tracks the relationship between two exponential moving averages, typically the 12-period and 26-period EMAs, with a 9-period signal line. Retail traders commonly look for signal line crossovers as buy and sell triggers. However, studies analyzing MACD effectiveness have revealed accuracy rates between 52% and 55% in many testing scenarios. The indicator's sensitivity to small price changes makes it prone to generating excessive signals in ranging markets, often resulting in whipsaw trades that erode capital.
Moving averages smooth price data to identify trend direction, with traders watching for price crossovers above or below key averages like the 50-period or 200-period lines. Research on moving average strategies has demonstrated mixed results, with accuracy rates around 58% in various market conditions. While useful for identifying established trends, moving averages inherently lag price action, often causing traders to enter trends late and exit after reversals have already begun.
The Retail Approach Limitations
The fundamental limitation of retail indicators is that they analyze price derivatives rather than the underlying cause of price movement. RSI, MACD, and moving averages all calculate mathematical transformations of past prices, creating secondary data layers removed from actual market mechanics. This approach assumes that historical price patterns contain sufficient information to predict future movements, an assumption that breaks down when market conditions shift or when large institutional orders alter supply and demand dynamics.
Retail traders using these indicators face several structural disadvantages. They lack access to real-time order flow data showing where large institutions are placing bids and offers. They cannot see dark pool transactions that account for approximately 30-50% of institutional order flow in equity markets. They have no visibility into the order book depth that reveals actual liquidity at various price levels. Most critically, retail indicators provide the same signals to millions of traders simultaneously, creating crowded trades that institutional algorithms routinely exploit.
Market research has consistently demonstrated that combining multiple retail indicators—such as using RSI alongside MACD—can improve results but still falls short of institutional approaches. A study examining combined indicator strategies found that while integration of RSI and MACD could explain 98.45% of price movements in backtesting, real-time implementation produced significantly lower returns. This performance gap occurs because retail indicators fail to account for market microstructure factors that institutional traders actively monitor.
Institutional Trading Context
Market Microstructure Analysis
Professional traders operate within a fundamentally different analytical framework centered on market microstructure—the study of how orders translate into executed trades and price changes. This approach examines the bid-ask spread, order book depth, trading volume at specific price levels, and the sequence of trades to understand the actual mechanics of price discovery. Rather than deriving signals from price history, microstructure analysis reveals the real-time balance between supply and demand at granular price levels.
Institutional traders pay particular attention to the order book, which displays all pending buy and sell orders at various price levels. A deep order book with substantial volume at multiple price levels indicates strong liquidity and reliable support or resistance. Conversely, a shallow order book with few orders signals low liquidity, making the market prone to slippage and sudden price movements. Professional traders analyze order book imbalances—situations where buy orders significantly outweigh sell orders or vice versa—to identify potential price direction before retail indicators generate signals.
Order flow analysis tracks the sequence and characteristics of executed trades to detect institutional activity. Large institutional orders are rarely executed as single transactions; instead, they are sliced into smaller pieces and executed over time to minimize market impact. By monitoring the time and sales tape for clusters of trades at similar prices, professionals can identify accumulation or distribution patterns that precede significant price moves. This information provides actionable intelligence that retail indicators cannot capture because they only process aggregated price data after trades have occurred.
Volume Profile and Footprint Charts
Volume profile displays the distribution of traded volume at each price level over a specified time period. Unlike standard volume bars that show total volume per time period, volume profile reveals where the market spent the most time and where the most trading activity occurred. The Point of Control (POC) represents the price level with the highest traded volume, often acting as a magnetic price level where value consensus exists. High-volume nodes (HVNs) indicate price levels where the market found acceptance, typically providing strong support or resistance. Low-volume nodes (LVNs) represent rejection areas where price moved quickly with little trading, often becoming zones of rapid price movement on subsequent tests.
Institutional traders use volume profile to identify market structure rather than generate timing signals. They recognize that prices tend to rotate around high-volume areas and accelerate through low-volume zones. This understanding allows professionals to position trades with favorable risk-reward ratios, buying near the lower boundary of high-volume acceptance zones with stops below the value area, or selling short at the upper boundary with defined risk above.
Footprint charts provide even more granular insight by displaying the distribution of buying and selling volume at each price level within individual candlesticks. Each price point is broken down into bid volume (selling pressure) and ask volume (buying pressure), showing exactly how many contracts traded on either side. When ask volume dominates at a price level, it signals aggressive buying; when bid volume dominates, it reflects aggressive selling. This information reveals whether a price move occurred due to genuine participation or simply lack of liquidity.
Professional traders analyze footprint charts for delta patterns—the difference between bid and ask volume. Positive delta indicates more buying than selling; negative delta shows more selling than buying. Delta divergences, where price makes new highs but delta fails to confirm, often signal exhaustion and impending reversals. Absorption patterns, where heavy volume at a specific price fails to move the market, frequently indicate institutional positioning and potential turning points.
Dark Pools and Hidden Liquidity
Dark pools are private trading venues where institutional investors execute large orders without displaying them on public exchanges. These alternative trading systems allow institutions to trade significant positions without telegraphing their intentions to the broader market, which would cause adverse price movements. Dark pools account for a substantial portion of institutional trading, with major platforms like Credit Suisse's CrossFinder handling approximately 6% of total U.S. equity trading volume.
The execution strategy in dark pools differs fundamentally from retail trading approaches. Institutional orders are typically executed at the National Best Bid and Offer (NBBO) midpoint, providing price improvement over public exchange execution. However, dark pools offer lower execution rates because orders must wait for matching counterparties rather than immediately taking available liquidity. Research indicates that optimal execution strategies typically allocate 30-50% of institutional order flow to dark pools, depending on order size and market conditions.
Professional traders monitor dark pool activity to gain insight into institutional positioning. While individual dark pool transactions are not immediately visible, aggregated dark pool volume data becomes available and provides clues about where large institutions are accumulating or distributing positions. Dark pool volume profiles reveal price levels where significant institutional trading occurred, often identifying hidden support and resistance levels that retail traders miss. When dark pool volume clusters at specific price levels, it signals institutional interest that may influence future price action.
Institutional Trading Strategies
Institutional strategies employ algorithmic execution to optimize trade placement while minimizing market impact. Market making strategies provide liquidity by continuously quoting bid and ask prices, profiting from the bid-ask spread while managing directional risk through hedging. High-frequency trading firms use latency arbitrage to exploit price discrepancies between exchanges, executing thousands of trades per second. These strategies require direct market access, co-location at exchange data centers, and ultra-low latency infrastructure unavailable to retail traders.
Statistical arbitrage strategies identify and exploit temporary mispricings between correlated assets using complex quantitative models. Volume participation algorithms trade proportionally to overall market volume, ensuring minimal market impact while executing large positions. Time-weighted average price (TWAP) algorithms slice orders evenly across a time period, while volume-weighted average price (VWAP) algorithms distribute orders based on historical volume patterns. These execution algorithms focus on minimizing transaction costs and information leakage rather than predicting price direction.
Institutional portfolio managers deploy dynamic asset allocation strategies using artificial intelligence and predictive modeling. They access proprietary research, private market reports, and exclusive data feeds unavailable to retail traders. Volatility arbitrage strategies trade differences between implied volatility from options and realized volatility in underlying assets. These sophisticated approaches require substantial capital, advanced technology infrastructure, and specialized expertise that create structural advantages over retail participants.
Professional Tool Ecosystems
Bloomberg Terminal and Institutional Platforms
The Bloomberg Terminal represents the gold standard for institutional trading infrastructure, providing comprehensive market data, analytics, and execution capabilities across all asset classes. The platform integrates proprietary and third-party research, real-time news, sophisticated charting tools, and multi-asset execution systems into a unified workspace. With access to more than 350,000 financial professionals globally, Bloomberg's Instant Bloomberg messaging system facilitates direct communication with counterparties, clients, and colleagues.
Professional traders use Bloomberg's powerful data analytics to run complex queries on market data, access earnings calls and analyst reports, and integrate fundamental data directly into their workflow. The platform's event calendar tracks earnings releases, economic announcements, and other market-moving events essential for fundamental analysis. Bloomberg's execution modules connect directly to exchanges and alternative trading venues, enabling seamless order placement with integrated pre- and post-trade analytics.
Similar institutional platforms like Thomson Reuters Eikon and FactSet provide comprehensive global market coverage, in-depth charting capabilities, and research tools that far exceed retail platform functionality. These systems offer proprietary analytics, custom scripting environments, and integration with quantitative research platforms that enable professionals to develop, backtest, and deploy sophisticated trading algorithms. The annual cost of these institutional platforms—typically $20,000 to $30,000 per user—reflects their comprehensive capabilities and creates a natural barrier separating retail and professional trading ecosystems.
Advanced Order Flow Platforms
Specialized order flow platforms like Bookmap provide real-time visualization of order book depth and liquidity. These tools display pending orders at each price level, showing exactly where large bids and offers exist in the market. Unlike standard depth of market (DOM) displays that show only the top few price levels, advanced platforms reveal the entire order book structure, enabling traders to identify hidden liquidity and potential support or resistance.
Time and sales data, combined with order book analysis, allows professionals to detect institutional order flow patterns. Large clustered volumes at specific price levels often mark professional buying or selling areas, guiding trade alignment with institutional participants. Platforms that integrate footprint charts with volume profile and order book depth provide comprehensive market context unavailable through standard retail charting packages.
MetaTrader 5, while accessible to retail traders, offers institutional-grade features including built-in indicators for technical analysis, the MetaEditor development environment for creating custom trading robots, and the ability to subscribe to professional trading signals. The platform supports multi-asset trading across forex, stocks, and futures with sophisticated order management capabilities. However, true institutional implementations of such platforms integrate proprietary data feeds, custom execution algorithms, and risk management systems that transform standard platforms into professional trading infrastructure.
How Professionals Actually Use Indicators
Context-Dependent Indicator Application
Professional traders do not abandon indicators entirely; rather, they use them within proper market context and in conjunction with order flow analysis. When pros use RSI, they focus on range shifts rather than simple overbought/oversold levels. In bullish market regimes, RSI typically oscillates between 40 and 80; in bearish regimes, between 20 and 60. Recognizing these regime shifts helps professionals stay aligned with dominant market conditions rather than counter-trading established trends based on generic 70/30 thresholds.
Advanced RSI techniques involve analyzing divergences in the context of market structure. A bullish divergence where price makes lower lows but RSI makes higher lows carries more weight when it occurs at a high-volume node identified through volume profile analysis. Professionals also monitor RSI on multiple timeframes, recognizing that momentum on higher timeframes (H1 and above) carries more structural significance than lower timeframe oscillations.
MACD application by professionals focuses on histogram behavior and zero-line interaction rather than simple crossovers. The MACD histogram reflects the distance between the MACD line and its signal line, offering insight into momentum acceleration or deceleration. Professionals recognize that MACD crossovers generate more reliable signals when they occur in the direction of the dominant trend identified through market structure analysis. They use MACD on higher timeframes in conjunction with price action and volume analysis to avoid noise that plagues retail implementations.
Moving averages serve as dynamic structure and liquidity reference points for institutional traders rather than simple trend indicators. Short-term moving averages such as the 20-period and 50-period gauge trend strength and pullback quality. In strong trends, price typically respects these averages as dynamic support or resistance, with repeated shallow pullbacks signaling trend continuation. Professionals recognize that moving averages represent areas where algorithmic execution often occurs, creating self-fulfilling support and resistance as institutional volume participation algorithms reference these levels.
Integration with Order Flow Analysis
The critical difference in professional indicator usage is the integration with order flow data. When an RSI oversold signal occurs, professionals examine the footprint chart to determine whether the selling was aggressive (high bid volume) or passive (sellers hitting bids with low volume). Aggressive selling at oversold levels suggests capitulation and potential reversal opportunity, while passive selling indicates lack of conviction and possible continuation.
Similarly, when MACD generates a bullish crossover, professionals verify the signal by checking whether the corresponding price action showed increasing ask volume (aggressive buying) in the footprint chart. They also examine whether the move occurred on increasing volume profile density, indicating genuine market participation rather than low-liquidity price drift. This multi-layered verification process dramatically improves signal reliability compared to acting on indicator signals alone.
Professionals use indicators to identify potential setup areas, then rely on order flow to determine precise entry timing and trade validity. For example, a trader might use moving averages to identify that a stock is in an uptrend and use RSI to locate potential pullback areas. However, the actual trade decision occurs only when order flow analysis confirms institutional buying interest—observed through positive delta accumulation, bid absorption, or dark pool volume clusters at support levels.
Capital Allocation and Risk Management
Institutional Scale Advantages
Institutional traders operate with significantly larger capital pools than retail participants, enabling access to exclusive investment opportunities and economies of scale. Banks, hedge funds, and pension funds can allocate millions or billions of dollars in single transactions, opening opportunities in private placements and direct market access unavailable to smaller traders. This capital advantage allows institutions to negotiate lower transaction costs per trade, improving overall profitability even on strategies with modest edge.
The scale advantage extends to technology infrastructure investment. Institutional firms maintain custom-built trading systems, co-location services at exchange data centers, and dedicated research teams that continuously develop new strategies. They employ risk management specialists who model portfolio exposures and hedge positions across multiple instruments and asset classes. This comprehensive infrastructure investment creates structural advantages that compound over time.
Retail traders typically use personal funds resulting in smaller trade sizes and limited diversification capability. Position sizing constraints prevent retail participants from properly scaling winning strategies or adequately diversifying across sectors and asset classes. While modern retail platforms have narrowed the technology gap by providing access to advanced charting and algorithmic tools, retail traders still lack the capital base necessary to access institutional-grade data feeds, execution quality, and research resources.
Execution Strategy Differences
Professional execution focuses on minimizing market impact and information leakage rather than predicting exact price direction. Institutional algorithms slice large orders into smaller pieces, executing across multiple venues including public exchanges and dark pools based on real-time liquidity assessments. These algorithms use sophisticated logic to avoid signaling their intentions to market participants who might trade ahead of the order.
Transaction cost analysis forms a critical component of institutional execution strategy. Professionals measure slippage, market impact, and opportunity cost to optimize order routing and timing. They recognize that aggressive execution saves time but increases costs through wider spreads and adverse selection, while passive execution improves pricing but risks non-execution and opportunity cost. Finding the optimal balance requires continuous analysis of execution quality across different venues and market conditions.
Retail execution typically emphasizes immediate fills at available prices without sophisticated slicing or routing logic. Most retail orders execute through payment for order flow arrangements where brokers route orders to market makers in exchange for rebates. While this model often provides retail traders with price improvement over exchange-quoted prices, it also means retail order flow is sold to institutional market makers who can trade against it with statistical advantages.
Technological Evolution and Market Impact
Algorithmic Trading Dominance
Algorithmic trading now accounts for approximately 92% of market activity, fundamentally changing market dynamics. These algorithms execute based on programmed logic that often incorporates technical indicators, making indicator-based trades increasingly crowded and less profitable. When millions of retail traders and thousands of algorithms all watch the same RSI or MACD signals, the resulting price action often features false breakouts and whipsaws as institutional algorithms exploit predictable retail behavior.
Machine learning algorithms have become increasingly sophisticated at pattern recognition and order flow prediction. Dark pool platforms employ artificial intelligence to analyze historical trading patterns and identify potential matches between institutional orders. High-frequency trading systems use predictive models to anticipate price movements milliseconds in advance, capturing profits before retail indicators generate signals. This technological arms race continues to accelerate, creating growing advantages for well-capitalized institutional participants.
Retail traders now have access to algorithmic execution tools previously available only to institutions. Modern platforms offer strategy backtesting, automated execution, and even machine learning integration. However, the effectiveness of these tools depends heavily on the underlying strategy and data quality. Retail algorithms using the same technical indicators as manual traders face the same fundamental limitations—they analyze price derivatives rather than the order flow that drives price movement.
Regulatory Considerations and Market Structure
Institutional trading faces stricter regulatory oversight than retail activity due to market impact potential and systemic risk. Regulations govern position reporting, disclosure requirements, and trading practices to ensure market fairness and stability. Institutions must navigate complex compliance frameworks including short-selling restrictions, circuit breakers, and transparency requirements that don't apply to smaller retail participants.
Market structure evolution continues to create new opportunities and challenges for both institutional and retail participants. The rise of dark pools and alternative trading systems has fragmented liquidity across multiple venues, making order routing decisions more complex. Regulatory responses to high-frequency trading and market manipulation have introduced additional complexity to execution strategies. Understanding these structural factors has become essential for professional traders, while many retail participants remain focused solely on price charts and indicators.
Technology democratization has empowered retail traders with better tools and market access than ever before. Commission-free trading, fractional shares, and mobile platforms have removed barriers to market participation. However, improved access alone does not eliminate the advantages that institutional participants maintain through superior capital, technology, and market intelligence. The gap between retail and professional trading has narrowed in some respects while widening in others, particularly regarding access to order flow data and execution quality.
Bridging the Gap: Practical Steps for Traders
Transitioning from Indicators to Market Context
Traders seeking to elevate their approach should begin by integrating volume analysis with existing indicator-based strategies. Rather than abandoning familiar tools, use volume profile to identify high-probability zones where indicator signals are more likely to succeed. For example, an RSI oversold signal carries more weight when it occurs at a high-volume node that previously provided support. This integration improves signal reliability without requiring complete strategy overhaul.
Learning to read order book depth provides valuable context for trade timing. Many modern platforms now offer level 2 data showing pending orders at various price levels. Observe how price reacts when it approaches large bid or offer clusters—does it absorb the liquidity and continue, or does it reverse? This observation builds understanding of how institutional orders influence price action in real-time rather than retrospectively through lagging indicators.
Footprint chart analysis requires more learning curve but offers significant advantages for execution timing. Start by observing footprint patterns at key market structure levels identified through volume profile. Notice the delta patterns and volume distribution during breakouts, pullbacks, and reversals. Over time, these observations build intuition about order flow dynamics that dramatically improves trade execution compared to indicator-based timing alone.
Resource Allocation for Serious Traders
Traders committed to professional-level analysis should allocate resources toward quality data and platform capabilities. While Bloomberg Terminal remains cost-prohibitive for most individual traders, alternatives like TradingView, NinjaTrader, and specialized order flow platforms provide substantial capabilities at accessible price points. The investment in proper tools pays dividends through improved execution, better market understanding, and access to institutional-grade analysis techniques.
Education investment is equally important as platform subscriptions. Understanding market microstructure concepts, order flow dynamics, and institutional behavior requires dedicated study beyond reading indicator formulas. Quality educational resources, mentorship programs, and practice with real-time order flow data accelerate the learning process. Many traders spend years mastering indicators without understanding market mechanics; inverting this priority and focusing on how markets actually function produces better results faster.
Realistic expectations about timeframes and returns help maintain psychological discipline during the transition. Professional traders often hold positions longer than retail participants, recognizing that institutional order flow plays out over hours, days, or weeks rather than minutes. They focus on risk-adjusted returns and consistency rather than home-run trades. Adopting institutional time horizons and risk management practices, even with smaller capital, improves long-term performance by reducing overtrading and emotional decision-making that plague retail accounts.
Conclusion
The divide between retail indicator usage and institutional trading context represents fundamentally different approaches to market analysis. Retail traders relying solely on RSI, MACD, and moving averages analyze historical price derivatives without insight into the order flow that actually drives price movement. Professional traders focus on market microstructure, order flow, volume distribution, and dark pool activity to understand real-time supply and demand dynamics.
This gap has significant performance implications. While retail indicators can identify potential trade areas, they lack the precision and reliability that order flow analysis provides. Institutional participants use superior tools, data, and strategies that create structural advantages in execution quality and market intelligence. However, retail traders can narrow this gap by integrating volume analysis, learning order flow concepts, and adopting professional risk management practices.
The path from retail to professional-grade analysis requires investment in education, tools, and practice. Rather than viewing indicators as complete trading systems, use them as initial filters within broader market context provided by volume profile, footprint charts, and order flow data. This integrated approach combines the accessibility of technical indicators with the precision of institutional analysis techniques, creating a framework that bridges the gap between retail and professional trading.
Understanding what professional traders actually use—order flow, market microstructure, dark pool data, and sophisticated execution algorithms—provides perspective on the limitations of indicator-based approaches. While not every retail trader can replicate institutional infrastructure, incorporating professional concepts and tools into existing strategies dramatically improves market understanding and execution quality. The market continues evolving toward algorithm-dominated, microstructure-focused trading; adapting to this reality by moving beyond simple indicators represents essential evolution for serious traders.


Comments ()