Gold vs US Real Yields: The Relationship Traders Must Understand
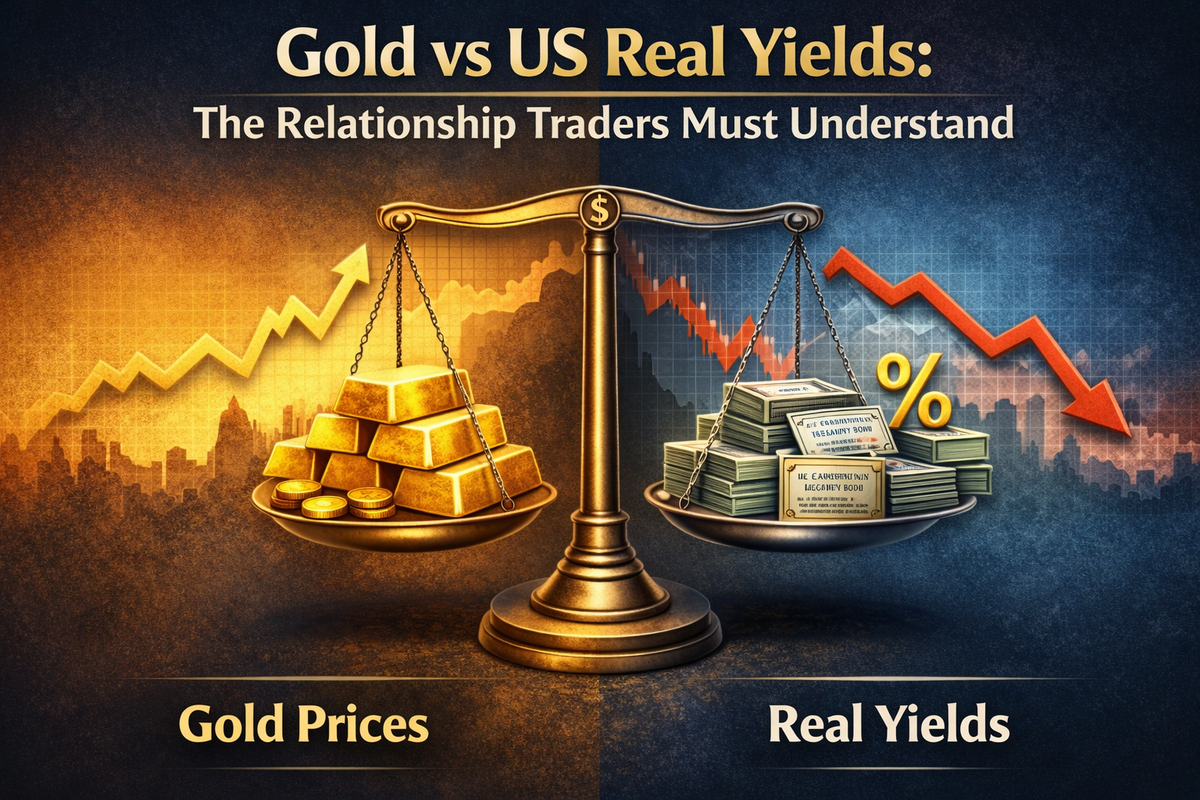
The relationship between gold prices and US real yields represents one of the most important dynamics in financial markets today. For traders navigating precious metals and broader portfolio strategies, understanding this inverse correlation provides critical insights into gold price movements and optimal entry points. This relationship has historically shown a correlation coefficient of -0.82, meaning when real yields decline, gold prices typically rise, and vice versa.
However, recent market developments since 2022 have challenged this traditional relationship, creating both confusion and opportunity for informed traders. This article explores the fundamental mechanics of this relationship, why it exists, how to monitor it effectively, and what the recent breakdown in correlation means for trading strategies going forward.
What Are US Real Yields?
US real yields represent the actual return investors earn on Treasury securities after accounting for inflation. Unlike nominal yields that simply reflect the stated interest rate, real yields provide a more accurate picture of purchasing power growth or erosion.
Real yields are most commonly measured through Treasury Inflation-Protected Securities (TIPS), which are US government bonds specifically designed to protect investors from inflation. The yield on these securities automatically adjusts based on the Consumer Price Index (CPI), providing a direct market-based measure of real interest rates.
The calculation is straightforward: Real Yield = Nominal Treasury Yield - Expected Inflation Rate. For instance, if a 10-year Treasury bond offers a nominal yield of 4.3% and the market expects inflation of 2.3% over that period, the real yield would be approximately 2.0%.
How TIPS Function in Practice
When investors purchase TIPS, they receive a fixed coupon rate applied to an inflation-adjusted principal amount. If $1,000 is invested in a 10-year TIPS with a 2% coupon rate and inflation runs at 3% over the next year, the principal adjusts to $1,030, and the interest payment becomes $20.60 rather than $20.00. This mechanism ensures that both the principal and income keep pace with rising prices.
The 10-year TIPS yield has become the market standard for measuring real interest rates and serves as a critical reference point for gold traders. As of late 2025, 10-year TIPS yields have averaged around 1.97% per annum, representing the highest levels since 2007.
The Historical Inverse Relationship Explained
Gold and real interest rates have traditionally moved in opposite directions due to fundamental economic principles centered on opportunity cost. Between 2003 and 2021, dollar gold prices and 10-year TIPS yields showed a significantly negative correlation averaging -0.73 on a rolling 12-month basis.
The Opportunity Cost Dynamic
Gold is a non-yielding asset—it pays no interest, dividends, or coupons. When real interest rates are high, investors can earn substantial returns from bonds and other interest-bearing assets while also preserving purchasing power. This creates a high opportunity cost for holding gold, as investors sacrifice those real returns by choosing the yellow metal instead.
Conversely, when real yields fall or turn negative, the opportunity cost of holding gold diminishes substantially. In negative real rate environments, holding cash or bonds actually guarantees a loss of purchasing power over time, making gold's role as a store of value significantly more attractive.
Why Real Yields Matter More Than Nominal Rates
Real interest rates provide far more predictive power for gold prices than nominal rates alone. The reason lies in inflation's dual impact on both bonds and gold. When nominal interest rates rise but inflation rises even faster, real returns on bonds become negative despite higher stated yields. In these conditions, gold typically performs exceptionally well because it serves as an inflation hedge.
Research from Erb and Harvey quantified this relationship, finding the correlation between real interest rates and gold prices at -0.82. PIMCO's analysis further demonstrated that a 100-basis-point increase in 10-year real yields has historically led to an 18% decline in the inflation-adjusted price of gold, giving gold an effective "real duration" of 18 years.
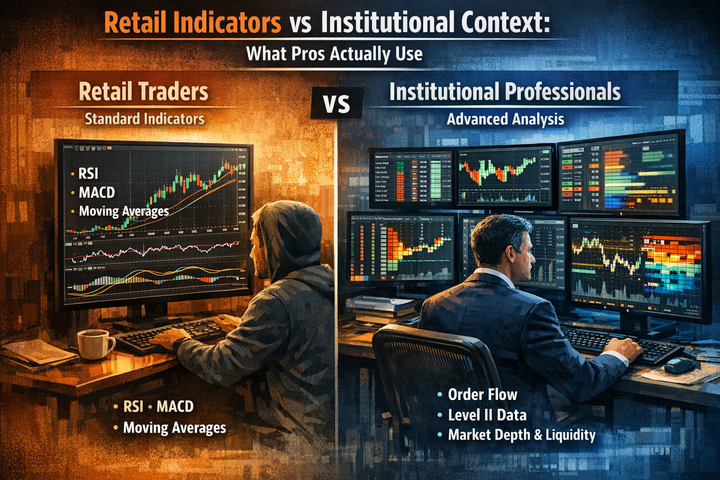
Practical Application: How Traders Monitor This Relationship
Understanding the theoretical relationship provides little value without knowing how to apply it practically. Successful gold traders incorporate real yield analysis into their decision-making frameworks through several concrete methods.
Key Indicators to Track
The 10-year TIPS yield serves as the primary indicator for this relationship. Traders can access this data through financial platforms, with the symbol typically listed as US10Y TIPS or similar designations. Many professional traders compare this yield directly against gold price movements on dual-axis charts to visualize the inverse relationship.
A practical trading rule states that when US Treasury yields decline by 1% or more, traders should look for buying opportunities in gold. Conversely, when yields rise by 1% or more, avoiding new gold purchases becomes prudent as the opportunity cost of holding the non-yielding metal increases.
Integration with Technical Analysis
Sophisticated traders combine real yield analysis with technical indicators for confirmation. For example, if real yields are declining (bullish for gold) and gold simultaneously breaks above key resistance levels or reclaims important moving averages like the 20-period simple moving average on a 4-hour chart, the probability of a successful trade increases substantially.
The relationship also informs risk management decisions. During periods when real yields are rising sharply while gold remains elevated, traders often tighten stop-losses or reduce position sizes to account for the headwinds created by increasing opportunity costs.
Monitoring the Dollar and VIX Simultaneously
While real yields provide the primary framework, professional gold traders monitor multiple correlated factors. The US Dollar Index typically shows a -0.75 correlation with gold, as a strengthening dollar makes gold more expensive for international buyers. The VIX volatility index also matters, as rising market fear often coincides with falling real yields and rising gold demand.
When all three indicators align—declining real yields, a weakening dollar, and rising VIX—gold tends to move with the most conviction, creating high-probability trading setups. Conversely, when yields climb while the dollar strengthens and equities remain strong, the risk-on environment makes gold trades considerably more challenging.
The Recent Breakdown in Correlation
One of the most significant developments in gold markets has been the weakening of the traditional gold-real yields relationship beginning in 2022. This breakdown has puzzled many market participants and requires understanding to avoid costly trading mistakes.
What Changed in 2022-2024
From 2022 onwards, the correlation between gold prices and US TIPS yields shifted dramatically. The median correlation reading moved from -0.73 (strongly negative) to approximately +0.02 over the past four years, essentially indicating no consistent relationship. Most notably, as real rates rose to 2.5% in October 2023—levels that historically would have crushed gold prices—the metal actually continued rising.
BMO Capital Markets published research in 2024 declaring the gold-real rate correlation "broken," noting it fell apart amid the sharp real rate moves of 2022 and had not re-established itself. The correlation of gold with 10-year TIPS yields fell to a relatively low -0.40 in 2018 and continued weakening thereafter.
The Central Bank Buying Phenomenon
The primary driver behind this correlation breakdown has been unprecedented central bank gold purchases. Net central bank gold purchases more than doubled from 2022 to 2024, surpassing 1,000 tonnes annually. This surge was primarily driven by central banks in Asia, including China, India, and Japan, as well as emerging markets more broadly.
These purchases have been strategic rather than price-sensitive, meaning central banks bought gold regardless of real yield levels as part of reserve diversification and de-dollarization efforts. This created a "floor" under gold prices that traditional supply-demand dynamics and interest rate relationships couldn't explain.
By October 2025, gold had surged to $4,000 per troy ounce, with prices doubling in less than two years. Analysts attribute this to central banks stockpiling bullion even as real yields remained historically elevated.
Gold's "Reduced Sensitivity" to Real Yields
Market analysts now describe gold as having "reduced sensitivity to real yields," particularly for 2025-2026 projections. MKS Pamp strategist Nicky Shiels characterizes the current environment as "early in a debasement cycle," positioning gold as "a strategic allocation with reduced sensitivity to real yields or the Dollar".
Despite 10-year real yields averaging 1.97% in 2025—the highest since 2007—gold bullion has risen more than 65%, marking its sharpest annual gain since 1979. This represents a fundamental regime change in gold market dynamics that traders must acknowledge.
Trading Strategies for the New Environment
The evolving relationship between gold and real yields demands adapted trading approaches. While the traditional inverse correlation hasn't completely disappeared, it no longer provides the reliable signal it once did.
Multi-Factor Analysis Framework
Modern gold traders should employ a multi-factor framework rather than relying solely on real yields. This includes monitoring:
Real Yields: Still relevant, particularly for medium-term trend direction, but no longer deterministic.
Central Bank Activity: Track quarterly World Gold Council reports on official sector purchases, as these buying patterns now provide crucial support levels.
Geopolitical Risk: Escalating tensions, particularly involving major economies, have increasingly driven gold demand independent of interest rates.
Currency Dynamics: The US Dollar Index correlation remains strong at -0.75, providing complementary signals.
Chinese Market Flows: Chinese investor demand has become a significant factor, particularly during domestic equity market weakness.
Scenario-Based Trading Approaches
Scenario 1: Traditional Correlation Environment - When real yields decline sharply (50+ basis points) over several weeks while geopolitical tensions remain contained, the traditional inverse relationship may reassert itself temporarily. In these conditions, traders can use classic strategies of buying gold on real yield declines with targets based on historical price-yield relationships.
Scenario 2: Central Bank-Driven Markets - During quarters with confirmed strong central bank buying (400+ tonnes), gold may maintain elevated prices regardless of real yield movements. Traders should focus on technical support levels and avoid aggressive short positions even when yields rise.
Scenario 3: Crisis/Risk-Off Conditions - When VIX surges above 25-30 while real yields fall and the dollar weakens simultaneously, gold typically experiences strong rallies. These represent high-conviction opportunities for long positions with wider profit targets.
Practical Entry and Exit Strategies
For entries, traders should wait for alignment of at least two of three factors: declining real yields, technical breakouts above resistance, and confirmed risk-off sentiment. Rather than entering on real yield signals alone, confirmation through price action provides higher probability setups.
Stop-loss placement should consider volatility conditions. During high VIX environments, wider stops prevent premature exits from viable trades. As a baseline, stops below recent swing lows or key technical levels typically prove more effective than arbitrary percentage-based stops.
Position sizing should inverse-correlate with real yield uncertainty. When real yields are rising but gold remains strong (contradicting the traditional relationship), smaller positions acknowledge the conflicting signals. Conversely, when all indicators align, larger positions become appropriate within risk management parameters.
Understanding Break-Even Inflation
An important concept for traders monitoring real yields is break-even inflation, which represents the market's inflation expectations. This metric derives from the difference between nominal Treasury yields and TIPS yields.
Break-even inflation = Nominal Treasury Yield - TIPS Yield. If 10-year Treasuries yield 4.3% and 10-year TIPS yield 2.0%, the implied break-even inflation is 2.3%. This indicates the market expects average annual inflation of 2.3% over the next decade.
For gold traders, rising break-even inflation (indicating higher inflation expectations) typically supports gold prices even if real yields remain stable. The inflation premium becomes priced into gold as investors anticipate future purchasing power erosion.
Historical Performance Context
Understanding how gold has performed across different real yield environments provides valuable context for traders. Between 1979 and 2024, gold posted positive returns in 27 of 46 years (59%), demonstrating that while influenced by real yields, gold's performance depends on multiple factors.
The strongest gold bull markets have typically coincided with negative or declining real yields. During the 2000s commodity supercycle, gold rose from approximately $300 per ounce to $1,900 as real yields declined substantially. Similarly, during the COVID-19 pandemic, negative real yields coincided with gold surging past $2,000 for the first time.
However, the 2022-2025 period broke this pattern, with gold reaching $4,000 despite real yields at 18-year highs. This unprecedented divergence highlights the regime change in gold market drivers.
Risk Management Considerations
Trading gold based on real yield relationships requires robust risk management given the recent correlation breakdown. Several principles help traders navigate this complexity.
Position Concentration Limits
Gold should represent a measured portion of overall portfolio risk rather than concentrated exposure. Professional guidelines suggest limiting single commodity exposure to 5-15% of trading capital, depending on risk tolerance and account size.
Correlation Monitoring
Traders should regularly calculate the rolling 90-day correlation between gold and 10-year TIPS yields. When this correlation approaches zero or turns positive (as it has recently), traditional yield-based signals become unreliable, warranting reduced position sizes or alternative strategies.
Macro Event Awareness
Major macroeconomic releases—particularly Consumer Price Index (CPI) reports, Federal Reserve policy announcements, and non-farm payroll data—can cause sharp movements in both real yields and gold prices. Traders should either avoid holding positions through these events or use options strategies to hedge gamma risk.
Leverage Discipline
Gold's increased volatility during the 2022-2025 period, with daily moves of $50-100 becoming common, makes leverage particularly dangerous. Conservative leverage ratios (maximum 3:1, preferably 2:1 or less) help ensure that even significant adverse moves don't trigger account-threatening losses.
Tools and Platforms for Monitoring
Effective monitoring of the gold-real yields relationship requires access to quality data and analytical tools. Several resources serve professional and retail traders alike.
The US Treasury Department publishes daily TIPS yields on TreasuryDirect.gov, providing the official source for real yield data. Financial terminals like Bloomberg, Refinitiv, and FactSet offer comprehensive real-time data with customizable charting comparing gold prices directly against TIPS yields.
For retail traders, websites like LongTermTrends.net maintain updated charts showing the historical relationship between gold and real yields, including correlation coefficients over various timeframes. The World Gold Council publishes quarterly demand trends reports that detail central bank purchases and other supply-demand factors.
Trading platforms such as MetaTrader 4/5, TradingView, and cTrader allow overlaying custom indicators tracking real yields alongside gold price charts. Many traders create custom alerts that trigger when real yields move beyond specific thresholds or when correlation metrics deviate from historical norms.
The Future of the Relationship
Looking forward, the gold-real yields relationship faces an uncertain future shaped by structural changes in global finance. Several factors will influence whether the traditional inverse correlation reasserts itself or remains broken.
De-Dollarization Trends
Ongoing efforts by major economies to reduce dollar dependence in international trade and reserves likely means sustained central bank gold buying regardless of interest rate levels. This structural bid provides support that wasn't present in previous decades when the correlation was more reliable.
Fiscal Dominance Concerns
Rising government debt levels across developed economies create scenarios where central banks may tolerate higher inflation to reduce real debt burdens. In these "fiscal dominance" regimes, nominal yields may not rise sufficiently to maintain positive real yields, creating favorable conditions for gold even if the traditional correlation weakens.
Monetary Policy Normalization
If central banks successfully engineer a return to sustainably positive real yields (2-3%) without triggering recession, the traditional inverse relationship may partially reassert itself. However, central bank purchases would likely continue providing a floor under prices even in higher real yield environments.
Key Takeaways for Traders
The relationship between gold and US real yields remains important but has evolved significantly. Traders must understand both the traditional dynamics and recent changes to navigate markets effectively.
Real yields measure returns after inflation and are best tracked through 10-year TIPS yields, which have historically shown a -0.82 correlation with gold prices. This inverse relationship exists because rising real yields increase the opportunity cost of holding non-yielding gold.
However, since 2022, unprecedented central bank buying has weakened this correlation substantially, with gold rising to $4,000 per ounce despite real yields at 18-year highs. This regime change means traders can no longer rely solely on real yield signals for gold trading decisions.
Successful modern gold trading requires a multi-factor approach incorporating real yields, central bank activity, geopolitical risk, currency dynamics, and technical analysis. When multiple factors align, particularly declining real yields combined with risk-off sentiment and technical breakouts, high-probability trading opportunities emerge.
Risk management becomes especially critical when traditional correlations break down, requiring disciplined position sizing, appropriate stop-loss placement, and continuous monitoring of correlation metrics. Traders who adapt their strategies to acknowledge both the historical relationship and its recent evolution position themselves to capitalize on gold market opportunities while managing downside risk effectively.
The gold-real yields relationship exemplifies how markets evolve and how successful traders must continuously update their frameworks rather than rigidly adhering to historical patterns. Understanding this dynamic thoroughly separates informed traders from those caught off-guard by regime changes in market behavior.

Comments ()