Gold During CPI, NFP, FOMC: A Risk-Controlled Trading Plan
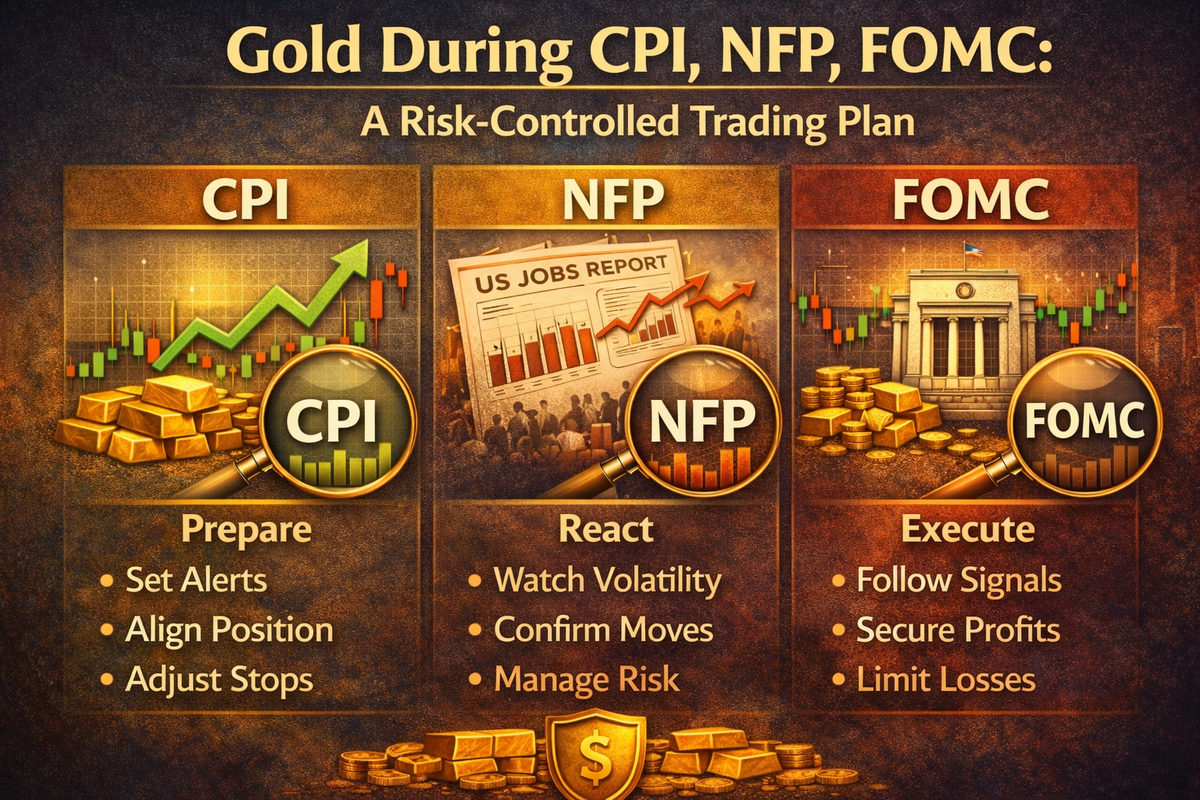
Gold stands as one of the most volatile yet opportunity-rich assets when major economic events occur. The Consumer Price Index (CPI), Non-Farm Payrolls (NFP), and Federal Open Market Committee (FOMC) announcements consistently trigger significant price movements in gold markets, with fluctuations ranging from 100 to 300 pips within minutes of data releases. Understanding how to navigate these high-impact events with a disciplined, risk-controlled approach separates successful traders from those who suffer unnecessary losses.
Understanding the Gold-Economic Data Relationship
Gold's status as a non-yield-bearing asset makes it particularly sensitive to economic indicators that influence interest rates, inflation expectations, and currency strength. The precious metal serves dual functions in financial markets: as an inflation hedge and as a safe-haven asset during periods of economic uncertainty. This dual nature creates complex price dynamics when economic data releases challenge or confirm market expectations.
The US Dollar Connection
The inverse relationship between gold and the US Dollar Index (DXY) forms a cornerstone of gold price movements. When the dollar strengthens following positive economic data, gold typically faces downward pressure as international buyers require more of their home currency to purchase the same amount of gold. Conversely, dollar weakness often propels gold prices higher as the precious metal becomes more affordable for foreign buyers and investors seek alternatives to currency holdings.
Recent market performance illustrates this dynamic clearly. During early 2025, the dollar index fell approximately 10.8% in the first half of the year, while gold simultaneously hit new record highs as central banks increased purchasing amid dollar devaluation concerns. This inverse correlation provides traders with a predictive framework when analyzing potential gold movements around economic releases.
CPI Releases and Gold Price Action
The Consumer Price Index measures the change in prices paid by consumers for goods and services, serving as the primary gauge of inflation in the economy. Gold's historical role as an inflation hedge makes CPI releases particularly significant for gold traders, though the relationship proves more nuanced than simple correlations suggest.
How Gold Reacts to CPI Data
Higher-than-expected CPI readings typically support gold prices as investors seek protection against purchasing power erosion. The recent January 2026 CPI release demonstrated this pattern when core CPI rose 0.2% in December, coming in below market expectations, while headline CPI increased 0.3% matching forecasts. Gold responded by ticking higher, trading around $4,615 and approaching record highs near $4,630.
However, the Federal Reserve's policy response to inflation data introduces complexity. When CPI exceeds expectations, markets may anticipate more aggressive interest rate hikes, which can create short-term bearish pressure on gold despite the inflation-hedge narrative. This dual interpretation requires traders to consider not just the data itself, but the broader monetary policy implications.
Recent CPI Impact Examples
December 2025's inflation data provided clear evidence of gold's sensitivity to CPI releases. When US CPI rose 0.3% in December 2025, gold prices held solid gains above $4,600 an ounce, with analysts noting that elevated inflation provides continued support for the precious metal. The softer-than-expected core CPI (+2.6% versus +2.7% expected) kept Federal Reserve easing hopes alive, contributing to safe-haven demand.
The immediate market reaction saw spot gold smash all-time highs of $4,634 per ounce on January 13, 2026, before settling around $4,591. This volatility spike of over $40 within hours demonstrates the substantial risk and opportunity that CPI releases present to gold traders.
NFP and Gold Trading Dynamics
Non-Farm Payrolls data, released on the first Friday of each month, reports the change in the number of employed people in the United States, excluding the agricultural sector. This employment indicator provides crucial insights into economic strength and influences Federal Reserve policy expectations, making it one of the most market-moving events for gold traders.
The NFP-Gold Mechanism
Strong NFP readings (more jobs added than expected) signal economic robustness, potentially leading central banks toward interest rate increases to prevent overheating. This scenario typically strengthens the US dollar and creates downward pressure on gold prices. Conversely, weak NFP data suggests economic slowdown, reducing the likelihood of rate hikes or even raising prospects for cuts, which generally supports gold prices.
The chain reaction unfolds predictably: Strong NFP → Strong economy → Potential rate hikes → USD strengthens → Gold falls. The inverse holds equally true: Weak NFP → Economic concerns → Rate cut expectations → USD weakens → Gold rises.
NFP Volatility Characteristics
Gold can experience movements of 100-300 pips instantly during NFP releases, creating both opportunity and substantial risk. The December 2025 NFP report illustrated typical market responses when payrolls rose by only 50,000, falling short of November's 56,000 (revised from 64,000) and missing market expectations of 60,000. Despite the weak headline number, the unemployment rate surprisingly ticked lower to 4.4% from 4.6%, while average hourly earnings climbed to 3.8% year-over-year from 3.6%.
These mixed signals within a single NFP release highlight the complexity traders face. The weak jobs number initially suggested dovish Federal Reserve policy ahead, supporting gold, but stronger wage growth raised inflation concerns that could justify continued tight monetary policy. Professional traders must rapidly analyze multiple data points within the NFP report rather than reacting solely to the headline figure.
FOMC Meetings and Gold Price Movements
The Federal Open Market Committee meets eight times annually to set interest rates and establish monetary policy direction. FOMC announcements represent the most significant scheduled event for gold markets, as they directly determine the opportunity cost of holding non-yielding assets like gold.
Interest Rate Decisions and Gold
When the FOMC raises interest rates, gold typically faces headwinds as investors migrate toward yield-bearing assets like bonds and high-interest savings accounts. The inverse relationship between interest rates and gold prices stems from the opportunity cost principle—higher rates make the zero-yield nature of gold less attractive compared to alternatives.
The December 2024 FOMC meeting provided a textbook example of this dynamic. Despite internal Fed conflict and hawkish guidance suggesting fewer rate cuts in 2025, gold prices held firm in the $4,290-$4,310 range following the announcement. The market effectively looked past the Fed's tough rhetoric, betting that rising unemployment would ultimately force the central bank toward easing regardless of their current stance.
Dovish vs. Hawkish FOMC Statements
Market participants closely analyze not just rate decisions but the accompanying policy statements and press conference language. When the FOMC adopts a more dovish tone than expected (suggesting slower rate increases or potential cuts), gold prices often rise as this implies lower real interest rates ahead. The converse occurs when unexpectedly hawkish language emerges, potentially triggering sharp gold selloffs.
The policy statement's forward guidance carries particular weight. References to inflation persistence, labor market strength, or economic growth projections all influence gold trader positioning. Quantitative easing announcements or balance sheet expansion programs historically correlate with major gold rallies, as money supply expansion raises currency debasement concerns.
Building a Risk-Controlled Trading Plan
Trading gold during high-impact economic releases requires a fundamentally different approach than standard technical trading. The sudden, violent price movements that characterize CPI, NFP, and FOMC events can invalidate technical setups within seconds, making robust risk management essential rather than optional.
Pre-Event Preparation Strategies
Successful event trading begins hours or even days before the actual release. Traders should reduce position sizes before major announcements, using either wider stops with smaller lots or eliminating positions entirely if risk tolerance doesn't accommodate the potential volatility. Many professional traders choose not to hold any gold positions during major releases, viewing the unpredictable price action as outside their strategic framework.
For those who decide to maintain exposure through events, protective measures become critical. Tightening stop-losses on existing positions or partially closing profitable trades ahead of announcements preserves capital while maintaining some market participation. The goal centers on surviving the volatility spike rather than maximizing profit during the chaotic initial minutes following data releases.
Position Sizing for Event Volatility
Proper position sizing stands as the cornerstone of risk management for event-driven gold trading. A position size calculator specifically calibrated for XAU/USD helps determine appropriate lot sizes based on account equity, risk tolerance, and stop-loss distance. During high-volatility events, reducing standard position size by 50-75% provides a buffer against the wider-than-normal price swings.
The calculation must account for gold's unique volatility profile. In periods of high volatility around major economic releases, traders should consider reducing position sizes to account for wider price swings that could otherwise trigger stops designed for normal market conditions. The formula remains consistent: never risk more than 1-2% of account equity on a single trade, but during major events, aiming for 0.5-1% provides additional protection.
Stop-Loss Placement Around Economic Events
Traditional technical stop-loss placement fails during major economic releases as prices can gap through stop levels, resulting in slippage and larger-than-intended losses. Event-specific stop-loss strategies require wider placement to avoid premature triggering from volatility spikes that reverse quickly.
Using volatility-based stops calculated from Average True Range (ATR) over recent periods provides more appropriate levels than fixed pip distances. For major events, multiplying normal ATR-based stops by 1.5 to 2.0 accommodates the expanded price range while still defining maximum acceptable loss. Alternatively, placing stops beyond significant technical levels (major support/resistance zones identified on daily charts) offers price action-based protection less susceptible to intraday noise.
Strategic Approaches to Event Trading
Different trading philosophies suit different trader personalities and risk profiles when approaching gold during major economic events. Understanding these strategic frameworks allows traders to select methods aligned with their strengths and constraints.
The Avoidance Strategy
The most conservative approach involves complete market exit ahead of major releases. This strategy eliminates event risk entirely, preserving capital for trading during more predictable market conditions. Traders employing this method typically close all positions 30-60 minutes before scheduled announcements and wait for post-event price action to stabilize before re-entering.
The avoidance strategy particularly suits traders with smaller account sizes who cannot absorb potential losses from adverse event outcomes, or those whose trading systems rely on technical analysis that major news events routinely invalidate. There's no shame in stepping aside—professional discretion means choosing battles wisely rather than participating in every market movement.
News Reaction Trading
News reaction trading involves waiting for the economic data release and allowing the market to establish a clear directional move before entering positions. This approach reduces the risk of entering on the wrong side during the chaotic initial price action immediately following announcements. Traders watch for the first major price swing, wait for a minor pullback or consolidation, then enter in the direction of the established trend.
The key advantage lies in letting the market digest the information and reveal its interpretation rather than predicting outcomes. For example, after a CPI release shows higher-than-expected inflation, waiting to see whether gold rallies on inflation-hedge buying or falls on rate-hike concerns provides clarity before committing capital. Entry points come 5-15 minutes after the release once initial volatility subsides and a trend emerges.
Pre-Positioning Strategy
Experienced traders sometimes take positions before major events based on fundamental analysis of likely outcomes and market positioning. This high-risk, high-reward approach requires deep understanding of economic indicators, Federal Reserve policy inclinations, and market expectations. Pre-positioning proves most effective when conviction exists about the likely data outcome and market reaction.
For instance, if consensus expectations for NFP appear too optimistic based on leading indicators like ADP employment data and jobless claims, taking a long gold position before the release could profit from a disappointing NFP print. However, this strategy demands larger account sizes to withstand being wrong, as stop-losses must be wide enough to avoid premature triggering from pre-event volatility.
Range Trading During Uncertainty
Some traders employ range-trading strategies around FOMC meetings when policy decisions appear highly uncertain. This approach involves identifying key support and resistance levels established in the days leading up to the event, then trading bounces off these levels with tight stops. The strategy assumes gold will consolidate within a defined range as traders await clarity, with breakouts occurring only after the actual announcement.
Range trading requires discipline to exit immediately when prices break beyond defined boundaries, as breakouts during major events typically produce strong directional moves. This method suits shorter timeframes and traders comfortable with multiple small trades rather than single large positions.
Technical Analysis for Event Trading
While fundamental analysis drives gold prices during major economic releases, technical analysis provides crucial support for entry timing, exit levels, and risk management parameters.
Multi-Timeframe Analysis
Analyzing gold charts across multiple timeframes creates a comprehensive view of market structure before major events. Daily charts reveal major support and resistance zones that may contain post-event price movement, while hourly charts show intermediate levels for more precise entry and exit planning. Five-minute charts become relevant during the actual event for timing specific entries in the direction of the established trend.
The daily chart's exponential moving averages (particularly 50-day and 200-day EMAs) often act as dynamic support or resistance during volatile periods. Gold's recent price action showed the metal holding above the rising nine-day EMA, keeping the near-term uptrend intact even amid event volatility. These technical levels provide objective reference points when emotions run high during fast-moving markets.
Trend-Following with News Confirmation
Combining trend analysis with news events creates a powerful framework. Traders identify the prevailing gold trend on daily charts, then use major economic releases as confirmation of trend strength or potential reversal points. When news aligns with the existing trend (for example, weak NFP supporting an existing gold uptrend), confidence increases for adding to positions or entering new trades in the trend direction.
Conversely, when news contradicts the prevailing trend but prices fail to reverse significantly, this often signals strong underlying momentum. For instance, if gold maintains an uptrend despite hawkish FOMC statements that would normally trigger selling, this divergence suggests powerful buying interest that may drive prices even higher once the initial news reaction settles.
Support and Resistance Planning
Identifying key support and resistance levels in advance of major events provides disciplined entry and exit frameworks that prevent emotional decision-making during volatility. These levels derive from previous swing highs and lows, pivot points, Fibonacci retracements, and round numbers that attract trader attention (like $4,600, $4,650, etc.).
Planning trade entries near support levels with stops just below provides favorable risk-reward setups, as the predetermined exit point limits downside while upside remains open. Similarly, targeting resistance levels for profit-taking creates objective exit criteria that don't require real-time decision-making when prices move rapidly.
Risk Management Mistakes to Avoid
Understanding common pitfalls helps traders develop more robust risk management frameworks for navigating gold during major economic events.
Averaging Into Losing Positions
One of the most dangerous practices involves adding to losing positions during or after major events. Gold's capacity for violent reversals means that a position moving against you can accelerate losses dramatically if additional size gets added. What appears to be a temporary spike against your position may represent the beginning of a sustained move in the opposite direction.
The psychological temptation to "average down" stems from hope that prices will revert to entry levels, but hope is not a trading strategy. When a position reaches its stop-loss level during event volatility, accepting the planned loss and moving on preserves capital for better opportunities rather than magnifying damage through size increases.
Overconfidence After Winning Streaks
Trading psychology research consistently shows that overconfidence following winning periods leads to increased risk-taking and larger position sizes. This pattern proves particularly dangerous around major economic events where a single adverse outcome can eliminate weeks of gains. Maintaining consistency in risk size regardless of recent performance provides more stable long-term results than varying position sizes based on recent win rates.
The disciplined approach involves risking the same percentage of account equity on every trade, whether coming off five winners or five losers. This consistency protects both capital during inevitable losing streaks and psychological stability that prevents emotional decision-making.
Ignoring Correlation Effects
Gold doesn't trade in isolation—its price movements correlate strongly with US dollar indices, Treasury yields, and equity market volatility. Ignoring these correlations during major events creates blind spots in risk assessment. For example, a trader long gold might also hold positions in other dollar-inverse assets, inadvertently concentrating risk in a single theme (dollar weakness) rather than maintaining true diversification.
Understanding correlation matrices between gold, DXY, real interest rates, and equities allows for portfolio-level risk management rather than position-level thinking. When major events approach, reviewing total exposure to specific themes prevents unintended concentration that could amplify losses if markets move adversely.
Practical Trading Plan Framework
A comprehensive trading plan for gold during CPI, NFP, and FOMC events should include specific protocols for before, during, and after each release.
Pre-Event Checklist
Create a written pre-event checklist completed at least one hour before scheduled releases. This should include: reviewing consensus expectations and whisper numbers for the upcoming data; assessing current gold positioning (long, short, or flat); calculating maximum position size based on account equity and elevated volatility conditions; identifying key technical levels (support, resistance, moving averages); setting calendar reminders for 15 minutes before the release; and determining whether to maintain, reduce, or close existing positions.
This systematic approach removes decision-making pressure during the time-compressed period immediately before releases when emotional trading becomes most likely. Having predetermined criteria for position management creates consistency and prevents reactive decisions driven by market noise rather than thoughtful analysis.
During-Event Protocols
Once economic data releases, having clear protocols prevents impulsive actions during extreme volatility. Avoid entering new positions in the first 1-3 minutes following the release as spreads widen and prices whipsaw unpredictably. If holding existing positions, resist the urge to adjust stops during the initial spike—either accept your predetermined stop or let the position work without interference.
For traders employing news reaction strategies, watch for the initial directional move to exhaust (typically 3-10 minutes post-release), wait for a minor pullback or consolidation pattern to form, confirm the move with volume analysis if available, then enter in the direction of the established trend with stops placed beyond the minor consolidation range. This patient approach often provides better entry prices than trying to catch the initial move.
Post-Event Analysis
After the event volatility settles (usually 30-60 minutes post-release), conduct objective post-event analysis regardless of trade outcomes. Document what the data showed versus expectations, how gold initially reacted and whether that reaction sustained or reversed, whether your trading plan was followed precisely, what worked well and what could improve, and any correlation effects observed with other assets.
This analytical process builds a personal database of event reactions that improves pattern recognition over time. Reviewing past CPI, NFP, and FOMC reactions helps identify tendencies in how gold responds to specific data configurations, creating an experiential edge beyond theoretical knowledge.
Current Market Context for Gold Trading
As of January 2026, gold trades near all-time highs above $4,600 per ounce, supported by multiple fundamental factors that provide context for event-driven trading. Major investment banks including Bank of America, JPMorgan, Goldman Sachs, Morgan Stanley, and UBS expect prices to hold in the $4,500-$5,000 range through 2026, citing anticipated Federal Reserve rate cuts, rising debt concerns, steady central bank buying, and persistent geopolitical uncertainty.
This bullish institutional outlook suggests an underlying bid beneath gold that may limit downside from disappointing economic data while amplifying upside from supportive releases. Central bank demand remains particularly strong, with nations continuing to diversify reserves away from dollar-denominated assets. This structural buying provides price support independent of short-term economic data fluctuations.
Inflation persistence above central bank targets creates a favorable macro environment for gold. UK CPIH inflation stands around 3.2%, significantly above the Bank of England's 2% target, while US core CPI holds at 2.6%, still elevated relative to the Federal Reserve's comfort zone. This "sticky inflation" environment reinforces gold's appeal as a purchasing power preservation tool regardless of month-to-month data variations.
Advanced Considerations for Sophisticated Traders
Beyond basic risk management and strategy selection, sophisticated traders incorporate additional layers of analysis when trading gold around major economic events.
Options Strategies for Event Risk
Options on gold futures provide alternative approaches to capturing event volatility while defining maximum risk. Strategies like straddles (buying both call and put options) profit from large price moves in either direction, making them suitable for events where the direction is uncertain but significant movement is expected. The premium cost of options establishes the maximum possible loss, eliminating tail risk from gap moves beyond stop-loss levels.
More complex strategies involve selling options to benefit from implied volatility collapse after events. Implied volatility typically rises ahead of major releases as options buyers seek protection, then falls sharply once uncertainty resolves. Traders can profit from this volatility crush through credit spreads or iron condors, though these strategies require substantial options knowledge and approval levels.
Interpreting Fed Speak and Forward Guidance
Federal Reserve communications extend beyond formal FOMC statements to include speeches by Fed governors, regional bank presidents, and Congressional testimony. Sophisticated traders parse this "Fed speak" for subtle shifts in policy thinking that might not yet appear in official statements. Changes in language around inflation assessments, employment conditions, or financial stability concerns often telegraph future policy shifts before they materialize in rate decisions.
The dot plot released quarterly with FOMC meetings shows individual Fed members' projections for future rate paths. Shifts in the median dot or increased dispersion among members provides insights into policy certainty and potential surprises ahead. When dots suggest fewer rate cuts than markets expect, gold faces headwinds; when dots shift dovish relative to expectations, gold typically rallies.
Quantitative Easing and Balance Sheet Policy
Beyond interest rates, Federal Reserve balance sheet policy significantly impacts gold prices. Quantitative easing programs that expand the Fed's asset holdings inject liquidity into financial systems, typically supporting gold prices through multiple channels: money supply expansion, currency debasement concerns, and lower long-term interest rates. Conversely, quantitative tightening (balance sheet reduction) tends to create headwinds for gold.
FOMC statements addressing balance sheet policy deserve close attention alongside rate decisions. Announcements about reducing the pace of balance sheet runoff or ending quantitative tightening often trigger gold rallies comparable to rate cut announcements. This policy tool gained prominence during the 2008 financial crisis and COVID-19 pandemic, and may resurface if economic conditions deteriorate significantly.
Conclusion
Trading gold during CPI, NFP, and FOMC events offers substantial profit potential but demands rigorous risk management and strategic discipline. The 100-300 pip price swings that routinely occur during these releases can generate significant gains for well-prepared traders while devastating accounts lacking proper protection. Success requires understanding the fundamental drivers behind each event type, implementing position sizing appropriate for elevated volatility, employing stop-loss strategies that account for expanded price ranges, and selecting trading approaches aligned with personal risk tolerance and account size.
The most successful event traders typically combine multiple approaches rather than relying on a single method. They might avoid some events entirely while actively trading others, or use reduced position sizes during uncertain releases while increasing size when high conviction exists. Flexibility within a disciplined framework proves more effective than rigid adherence to any single strategy.
Ultimately, risk-controlled gold trading during major economic events separates professional approaches from gambling. The difference lies not in outcomes on individual trades but in the systematic process applied consistently over time. By developing comprehensive trading plans, maintaining strict position sizing discipline, avoiding common psychological pitfalls, and continuously learning from both winning and losing trades, traders can navigate the explosive volatility of CPI, NFP, and FOMC events while protecting their capital and building long-term success in gold markets.
Comments ()