
XAU/USD Trading Signal & Deep Analysis for February 16, 2026
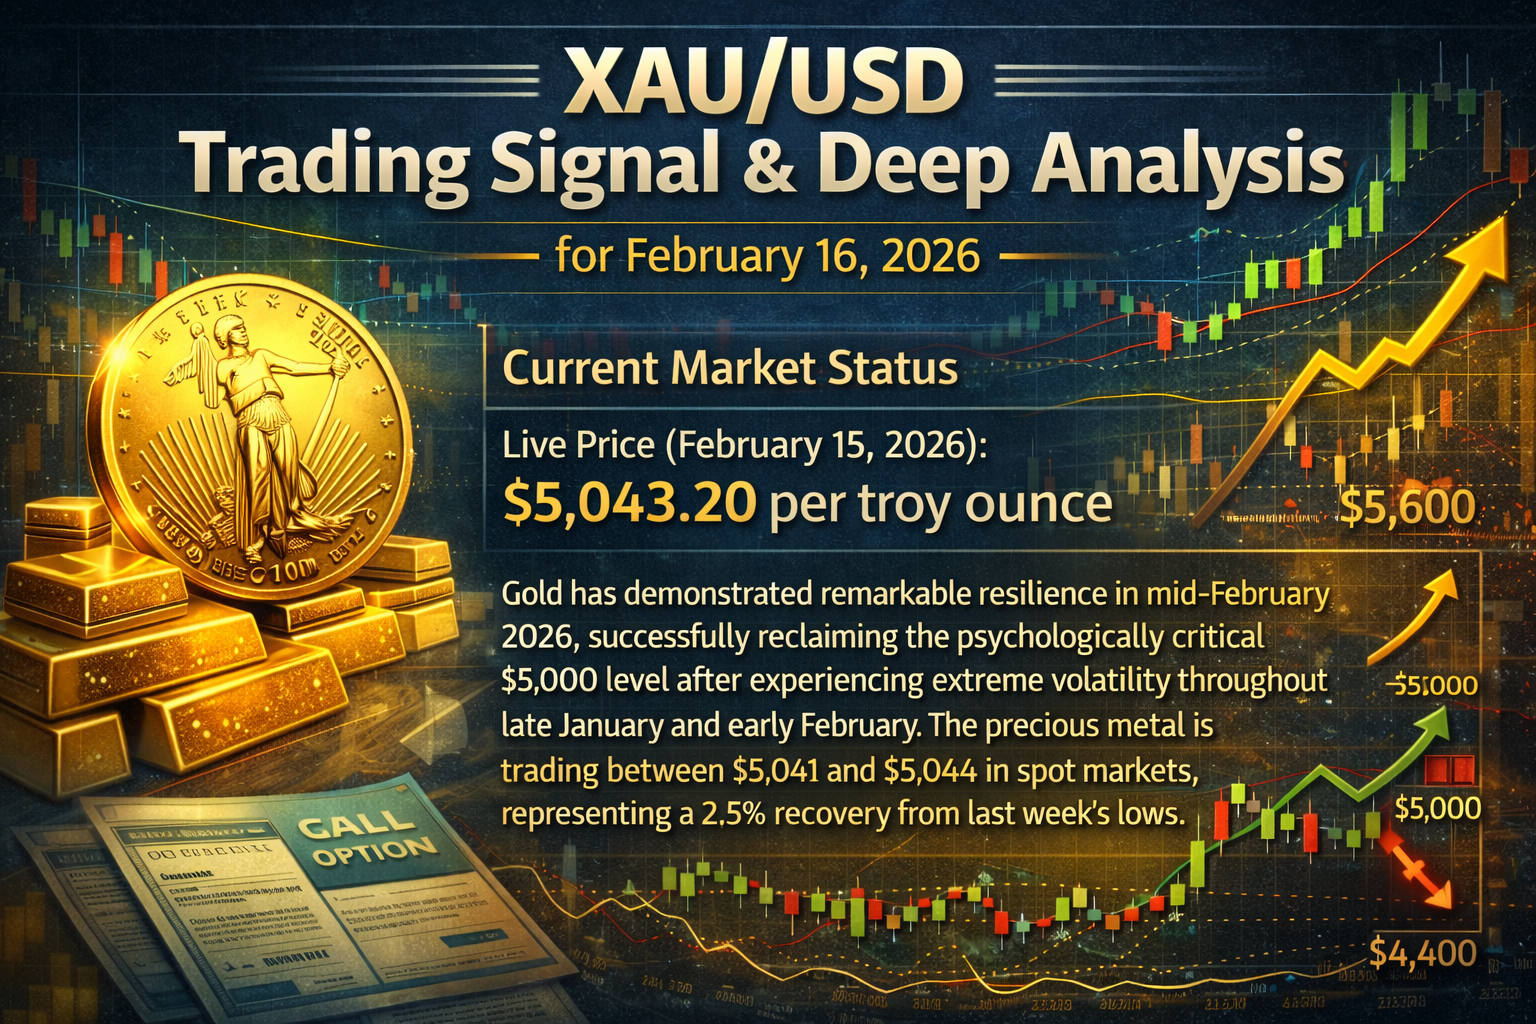
Current Market Status
Live Price (February 15, 2026): $5,043.20 per troy ounce
Gold has demonstrated remarkable resilience in mid-February 2026, successfully reclaiming the psychologically critical $5,000 level after experiencing extreme volatility throughout late January and early February. The precious metal is trading between $5,041 and $5,044 in spot markets, representing a 2.5% recovery from last week's lows. This rebound comes after a dramatic correction that saw prices plunge from an all-time high of $5,600 to lows near $4,400 within days.
Trading Signal for February 16, 2026
PRIMARY SIGNAL: BUY (BULLISH)
Entry Zone: $5,035 - $5,050
Target 1: $5,100 (Short-term)
Target 2: $5,146 (Medium-term)
Target 3: $5,200 - $5,298 (Extended target)
Stop Loss: $4,920 (Below key support at $4,950)
Risk-Reward Ratio: 1:2.5 to 1:3
Confidence Level: High (75-80%)
Time Horizon: 1-7 days
Signal Rationale
The bullish bias remains intact as long as XAU/USD maintains trading above the critical $4,950 support level. The $5,000 mark has transitioned from resistance to support, establishing what analysts describe as a "psychological rebasing of the market". This technical shift, combined with fundamental tailwinds, creates a favorable risk-reward setup for long positions.
Technical Analysis: Multi-Indicator Approach
Moving Average Analysis
Gold's price structure reveals strong bullish positioning across multiple timeframes. The precious metal is currently trading well above its 50-day Exponential Moving Average (EMA) at $4,947 and significantly above the 200-day EMA positioned at $4,809. The 20-day EMA sits at $4,971, providing dynamic support for the ongoing rally.
The upward-trending 100-period Simple Moving Average (SMA) on the 4-hour chart is providing crucial dynamic support around $4,970. This alignment of moving averages in ascending order confirms the bullish trend structure and suggests that buyers maintain control of the market direction.
Momentum Indicators
Relative Strength Index (RSI): The RSI reading of 57-61 indicates a neutral-to-bullish momentum profile. This positioning is ideal as it suggests room for further upside movement before reaching overbought conditions typically observed above 70. The RSI has recovered from oversold levels seen during the late January correction, demonstrating that buyers are actively gathering momentum.
Moving Average Convergence Divergence (MACD): The MACD indicator has generated a bullish signal, with the histogram showing positive values suggesting buying pressure. Although the MACD has eased slightly from recent peaks, indicating moderating upside momentum, the overall configuration remains supportive of higher prices.
Key Support and Resistance Levels
The technical landscape for gold presents clearly defined levels that will dictate near-term price action:
Critical Support Levels:
- $5,000: Psychological round number and newly established support
- $4,950: The "must-hold" zone serving as the new baseline for buyers
- $4,900: Secondary support level
- $4,880: Recent consolidation floor that has held firm
- $4,800: Major support confluence
- $4,761: Deep support floor established during late-January correction
Key Resistance Levels:
- $5,100: Immediate resistance that bulls must clear
- $5,146: Primary resistance; breaking above confirms end of consolidation
- $5,200: Next target following $5,100 breach
- $5,298: Secondary resistance for bullish breakout toward quarterly highs
- $5,451: January 30 high
- $5,600: Record high established in late January
Chart Pattern Recognition
Gold is exhibiting a consolidation pattern following its dramatic correction, with price action suggesting a "struck tuning fork" scenario—gradual rising consolidation on declining volatility. The recent recovery has printed a higher low above $4,880, which when combined with the ability to reclaim $5,000, establishes a constructive technical pattern.
A Fibonacci retracement analysis of the January decline shows that the 50% retracement level converges precisely with the $5,000 round number, explaining the strong support dynamics at this level. The price has successfully broken above this confluence zone, although it continues to consolidate rather than mounting an immediate assault on higher levels.
Fundamental Analysis: Multiple Catalyst Assessment
Inflation Dynamics and Federal Reserve Policy
The most significant fundamental development supporting gold prices is the cooling of US inflation. January's Consumer Price Index (CPI) data revealed annual inflation at 2.4%, down from previous readings and below market expectations. Core inflation, which excludes volatile food and energy components, registered at 2.5%. These lower-than-anticipated figures have strengthened the disinflation narrative that is crucial for gold's appeal as a non-yielding asset.
The Federal Reserve's policy trajectory has shifted decidedly dovish in response to cooling inflation. Market expectations now price in two to three interest rate cuts of 25 basis points each during 2026, with the bond market anticipating approximately 50 basis points of total easing. The CME FedWatch Tool currently suggests 45% probability of a rate cut by April 2026, with another reduction priced in for September.
Most analysts characterize potential rate cuts as "mid-cycle adjustments" designed to bring the federal funds rate down to a neutral range around 3%, from the current range of 3.50% to 3.75%. Fed Chairman Jerome Powell indicated in previous statements that the central bank is "well-positioned to wait to see how the economy evolves," but the path of least resistance appears to favor additional easing.
The dovish Fed policy stance creates a dual tailwind for gold. First, lower real yields reduce the opportunity cost of holding non-yielding gold. Second, Fed easing typically weakens the US Dollar by narrowing cross-border interest rate differentials and expanding liquidity.
US Dollar Weakness
The US Dollar Index (DXY) has entered a pronounced downtrend, trading at 96.88-96.92 as of February 13, 2026. Over the past month, the greenback has weakened by 2.27%, and over the past 12 months, it has declined by an substantial 9.21%. Trading Economics forecasts the DXY to trade at 96.64 by the end of the first quarter and potentially decline to 94.72 within 12 months.
This sustained dollar weakness is fundamentally supportive for gold, which is priced in dollars. A weaker dollar makes gold less expensive for holders of other currencies, stimulating international demand. The inverse correlation between the dollar and gold has been particularly pronounced during 2026, with gold rising approximately 75% year-over-year as the dollar deteriorated.
Lower Treasury yields have accompanied dollar weakness, with the 10-year yield retreating from recent highs as inflation data cooled. This yield environment enhances gold's relative attractiveness compared to fixed-income alternatives.
Central Bank Demand: Structural Support
Central bank gold purchases continue to provide structural support to prices, although the pace has moderated from record levels. During 2022-2024, central banks purchased over 1,000 tonnes annually, but 2026 estimates suggest net purchases of approximately 800 tonnes, representing about 26% of annual mine output.
Emerging market central banks, particularly Poland, China, and Turkey, are leading this diversification trend as they seek to reduce reliance on the US Dollar and protect against currency risks. This strategic buying represents price-insensitive demand that establishes a solid floor under gold prices and reduces downside vulnerability.
The shift toward gold reflects broader geopolitical trends, with nations seeking "neutral money" assets that are not subject to sanctions risk or geopolitical leverage. As global divisions and trade tensions persist, gold's role as a politically neutral reserve asset is becoming increasingly valued by monetary authorities worldwide.
Geopolitical Risk Premium
Geopolitical tensions continue to support safe-haven demand for gold. Current flashpoints include:
Iran-US Relations: The United States and Iran are scheduled to hold talks in Geneva on Tuesday, February 17, although significant disagreements remain. Washington insists that discussions include Tehran's missile capabilities, while Iran prefers to focus exclusively on nuclear issues. President Trump has signaled willingness to give diplomatic efforts approximately three more weeks before considering military options, though prediction markets suggest a US attack by June is unlikely.
Venezuelan Situation: Geopolitical instability stemming from the US apprehension of Venezuelan President Nicolas Maduro has contributed to heightened safe-haven demand for precious metals.
Russia-Ukraine Developments: While a major prisoner swap was facilitated by US-brokered talks, ongoing tensions in the region continue to support gold's appeal as a stability hedge.
These geopolitical uncertainties reinforce gold's traditional safe-haven status, providing price support even as some risk assets recover. Portfolio managers are increasingly allocating to gold as protection against rising government debt levels and economic uncertainty in major economies.
Economic Calendar: Week Ahead Analysis
Monday, February 16, 2026
Monday presents a favorable technical trading environment as it is a public holiday in both the United States and Canada. The absence of major economic data releases eliminates the risk of unexpected volatility from scheduled announcements. This creates an ideal environment for technical trading strategies, as price action is likely to be driven primarily by chart-based factors and positioning adjustments.
The entire week is also a public holiday in China for the Lunar New Year celebrations (February 16-23), which may result in reduced trading volumes from Asian participants. Lower liquidity can amplify price movements, but the strong fundamental backdrop suggests any volatility should favor the upside as long as key support levels hold.
Key Events Later in the Week
Tuesday, February 17:
- FOMC Meeting Minutes (19:00 GMT): This is the week's most market-moving event. The minutes from the Federal Reserve's most recent policy meeting will provide crucial insights into policymakers' thinking regarding the timing and pace of potential rate cuts. Dovish language emphasizing concerns about economic growth or satisfaction with inflation progress would likely boost gold prices. Conversely, hawkish commentary suggesting reluctance to cut rates could trigger profit-taking.
- UK CPI Data: British inflation figures could influence broader market sentiment regarding global inflation trends.
Wednesday-Friday:
- US Core PCE Price Index: The Fed's preferred inflation gauge
- US Advance GDP: Quarterly growth data
- US, German, and UK Flash PMI Data: Manufacturing and services sector health indicators
These data points later in the week could extend or reverse Monday's price action depending on their implications for Fed policy and economic growth.
Market Sentiment and Positioning
The recent price action reveals strong dip-buying interest, with traders consistently purchasing on declines toward the $5,000 level. This behavior pattern indicates that market participants view current prices as attractive relative to longer-term expectations, providing confidence that support levels will hold.
Institutional positioning data shows that open interest in April 2026 COMEX gold futures contracts remains elevated, signaling that large investors are maintaining or adding to gold exposure. This institutional commitment reduces the likelihood of a sustained breakdown below major support levels.
Volatility metrics suggest that the extreme price swings of late January are subsiding, with consolidation replacing panic selling. The Volatility Index (VIX) for gold options has declined from extreme levels, indicating that market uncertainty is normalizing. This volatility compression often precedes directional moves, and given the bullish fundamental backdrop, the next major move appears more likely to be upward.
Risk Factors and Alternative Scenarios
Bearish Risk Scenarios
Stronger-than-Expected US Economic Data: If upcoming employment, retail sales, or GDP data significantly exceed expectations, markets might reconsider the Fed easing timeline, potentially boosting the dollar and Treasury yields at gold's expense.
Federal Reserve Hawkish Shift: Should FOMC minutes on Tuesday reveal greater resistance to rate cuts among voting members, gold could face renewed selling pressure and potentially test support at $4,950 or lower.
Geopolitical De-escalation: Unexpected progress in Iran-US talks or other geopolitical flashpoints could reduce safe-haven demand temporarily.
Technical Breakdown: A decisive break below $4,950 would invalidate the bullish structure and potentially trigger stops, leading to a retest of $4,880 or even $4,800 support.
Bullish Catalyst Scenarios
Dovish FOMC Minutes: Strong language supporting earlier or more aggressive rate cuts would likely propel gold through $5,100 resistance quickly.
Dollar Acceleration Lower: Continued DXY weakness below 96.50 would provide additional tailwinds for dollar-denominated gold.
Supply Disruptions: Any news regarding production difficulties at major mines or refining bottlenecks would support prices through supply concerns.
Breakout Above $5,146: Clearing this technical resistance would confirm the end of consolidation and likely trigger momentum buying toward $5,298 and potentially a retest of the $5,600 record high.
Trading Strategy and Risk Management
Position Sizing and Management
For conservative traders, consider risking no more than 1-2% of trading capital on this position. Given the stop loss at $4,920 and entry around $5,040, this represents approximately 120 points of risk ($120 per standard lot). With Target 1 at $5,100, the reward is approximately 60 points, but extended targets at $5,146 and $5,200 offer 106 and 160 points respectively, providing attractive risk-reward ratios.
Entry Tactics
Aggressive Entry: Enter at current market levels ($5,040-$5,050) with full position size, anticipating continued strength.
Conservative Entry: Wait for a pullback to the $5,020-$5,030 zone to enter, improving risk-reward parameters. Alternatively, wait for a confirmed breakout above $5,100 before entering, sacrificing some profit potential for increased confirmation.
Exit Strategy
Partial Profit Taking: Consider taking 30-40% of position off at Target 1 ($5,100), another 30% at Target 2 ($5,146), and letting the remainder run toward Target 3 ($5,200-$5,298) with a trailing stop.
Stop Loss Management: Once price reaches $5,100, move stop loss to breakeven ($5,040). If $5,146 is reached, trail stop to $5,080 to protect profits while allowing for continued upside participation.
Time Stop: If the position fails to reach Target 1 within 48 hours and remains range-bound, consider reducing position size or exiting to redeploy capital elsewhere.
Alternative Trading Approaches
Range Trading Strategy
For traders who believe consolidation will continue, a range-trading approach between $5,000 support and $5,100 resistance could be employed:
- Buy: $5,010-$5,020 zone
- Sell: $5,090-$5,100 zone
- Stop Loss: $4,980 for longs, $5,120 for shorts
Breakout Strategy
For momentum traders preferring confirmation:
- Entry: Only above $5,110 (confirmed breakout)
- Target: $5,200, then $5,298
- Stop Loss: $5,050 (below breakout level)
Correlation Analysis
Gold's current behavior shows strong inverse correlation with the US Dollar Index (DXY) at approximately -0.75, meaning dollar movements explain much of gold's price action. Similarly, gold demonstrates positive correlation with other precious metals, though it's currently outperforming silver, platinum, and palladium.
The correlation with equity indices has been relatively low, with gold performing independently of the S&P 500's consolidation pattern. This low correlation enhances gold's portfolio diversification benefits during the current market environment.
Long-Term Outlook Context
While this analysis focuses on the immediate trading opportunity for February 16, it's worth noting that gold has risen 75% over the past year and 8.99% over the past month alone. This extraordinary performance reflects a structural bull market driven by:
- Monetary Policy Regime Shift: Transition from tightening to easing cycle globally
- Currency Debasement Concerns: Rising government debt levels worldwide
- Geopolitical Fragmentation: Multipolar world order increasing demand for neutral assets
- Supply Constraints: Mine production growth lagging demand increases
These longer-term drivers suggest that pullbacks represent buying opportunities within an ongoing bull market rather than signals of trend reversal.
Conclusion and Final Recommendation
The technical and fundamental analysis converges to support a bullish outlook for XAU/USD on February 16, 2026. Gold has successfully established support above the critical $5,000 psychological level and is well-positioned to challenge resistance at $5,100 and potentially $5,146 in the near term.
The absence of major economic data on Monday creates a favorable environment for technical follow-through, while the fundamental backdrop of cooling inflation, dovish Fed expectations, dollar weakness, and geopolitical tensions provides multiple tailwinds for higher prices.
Primary Recommendation: LONG XAU/USD
- Entry: $5,035-$5,050
- Stop Loss: $4,920
- Targets: $5,100 / $5,146 / $5,200
- Confidence: High (75-80%)
The key risk management principle is the $4,950 level—as long as gold maintains above this threshold, the bullish bias remains intact. A breach below $4,950 would require reassessment of the bullish thesis and potential position liquidation.
For Monday specifically, watch for:
- Price action at $5,050-$5,060 (if bullish momentum continues)
- Support defense at $5,020-$5,030 (if profit-taking occurs)
- Volume patterns (lower volumes due to Chinese holiday may reduce conviction)
- Sunday evening price action in Asian markets for early directional clues
This analysis represents an educational assessment of current market conditions based on technical and fundamental factors. Traders should conduct their own due diligence and adjust position sizing according to individual risk tolerance and account parameters.
Disclaimer: Trading in financial markets involves substantial risk and may not be suitable for all investors. This analysis is provided for educational purposes only and does not constitute investment advice. Past performance is not indicative of future results.