
XAU/USD Trading Signal & Deep Analysis - February 13, 2026
Live Price Action
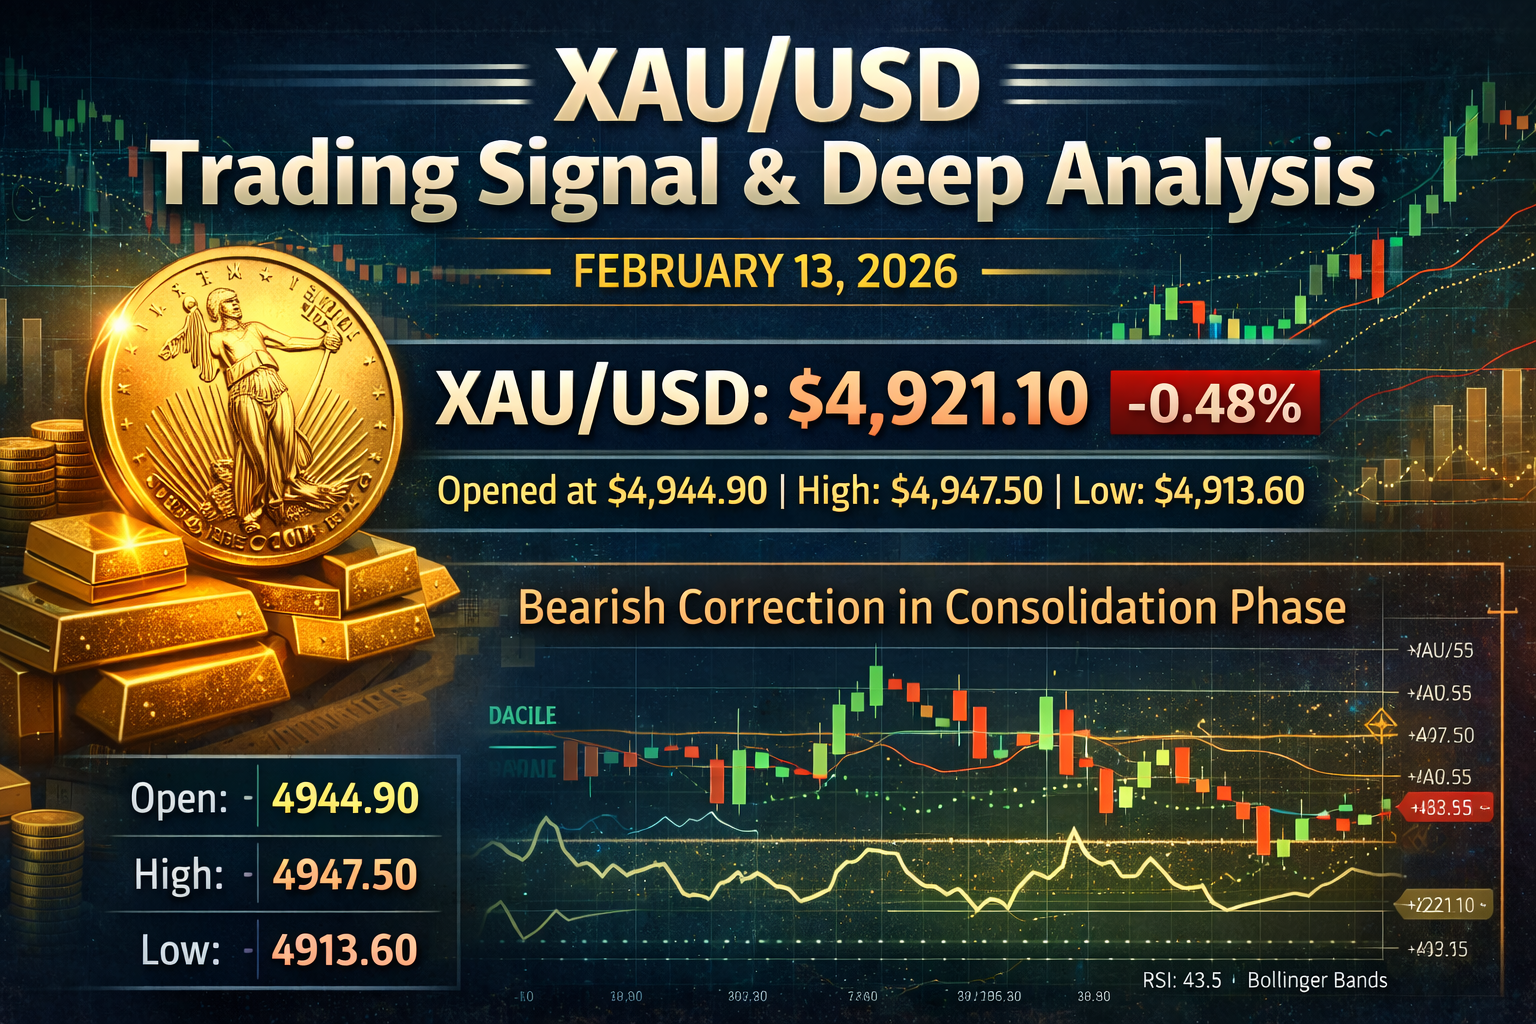
As of February 13, 2026, XAU/USD is trading at $4,921.10, marking a decline of -0.48% from the previous session. The pair opened at $4,944.90, reached an intraday high of $4,947.50, and tested a low of $4,913.60, demonstrating a bearish correction within a consolidation phase.
Market Context & Recent Price Behavior
Gold has experienced significant volatility in recent weeks, recovering from a dramatic 15.7% correction that saw prices plummet to $4,405 in late January 2026. This crash was triggered by the Federal Reserve Chair nomination of Kevin Warsh, which sparked expectations of tighter monetary policy and higher real interest rates. The precious metal rebounded sharply, surging past the psychologically significant $5,000 level on February 11, 2026, driven by collapsing Treasury yields, weak US economic data, and aggressive dip-buying.
The recovery reached $5,080.70 on February 12 before encountering resistance and pulling back. The current price action suggests gold is consolidating gains while digesting the recent rally, with traders awaiting further catalysts to determine the next directional move.
Technical Analysis
Key Support Levels
The technical structure reveals multiple critical support zones that traders should monitor closely:
- Immediate Support: $4,945 - This level represents the forecast support area and the lower boundary of the current consolidation range. A test of this level is expected as part of the ongoing bearish correction.
- Critical Support: $4,805 - Breaking below this level would invalidate the bullish scenario and signal a continuation of the decline toward $4,525. This represents a key risk management threshold for long positions.
- Major Support: $4,654-$4,655 - This corresponds to the 38.2% Fibonacci retracement level and the February 6 low. Multiple technical indicators converge at this zone, making it a robust support area.
- Secondary Support: $4,595-$4,550 - These levels represent deeper support zones that would come into play only if the primary levels fail.
Key Resistance Levels
The overhead resistance structure presents clear challenges for bullish momentum:
- Immediate Resistance: $5,000 - The psychological round number continues to act as dynamic resistance and aligns with the 100-period Simple Moving Average on the 4-hour chart. Gold must reclaim this level decisively to resume the uptrend.
- Near-Term Resistance: $5,100 - February's peak at this level has capped recent upside attempts. The pair is trading within a narrow range with upside attempts consistently rejected below this threshold.
- Critical Resistance: $5,165-$5,170 - A decisive breakout and close above this zone would accelerate gold's bullish momentum and confirm the resumption of the uptrend. This level represents the 78.6% Fibonacci retracement of the late January sell-off and aligns with a Gartley pattern target at $5,340.
Moving Averages Analysis
The moving average structure provides valuable context for the intermediate-term trend. Gold is currently trading above the 100-period Simple Moving Average, which sits around the $5,000 level and slopes higher, maintaining a bullish near-term bias. The price remaining above this dynamic support suggests the correction is likely temporary within an intact uptrend.
Moving averages indicate a short-term bullish trend, with prices having broken above the area between signal lines, indicating upward pressure from buyers and potential for continued growth from current levels.
Relative Strength Index (RSI)
The RSI indicator currently reads between 55-61 across different timeframes, creating a neutral-to-positive signal. The RSI at 58 suggests the price could move in either direction, as momentum is not clearly defined. This reading indicates neither overbought nor oversold conditions, providing room for movement in both directions.
An additional bullish signal would be generated if the price tests the trend line on the RSI indicator, which would suggest accumulation at lower levels. The RSI remaining above 50 supports the view that bullish sentiment is gradually building.
MACD (Moving Average Convergence Divergence)
The MACD presents mixed signals across different analytical timeframes. On the 4-hour chart, the MACD histogram shows mild bearish pressure, suggesting short-term downward momentum. However, the MACD remains above the zero line, which maintains the broader bullish structure.
On the daily timeframe, MACD is moving sideways near the zero line, showing no clear directional momentum. This neutral positioning suggests indecision in the market and the potential for a breakout in either direction once momentum develops. The MACD reading of 30.20 generates a Buy signal according to technical analysis models.
Stochastic Oscillator & Additional Indicators
The Stochastic (9,6) indicator registers at 95.11, creating a Sell signal due to overbought conditions. This suggests the recent rally may have overextended in the short term, supporting the case for a corrective pullback.
The Money Flow Index (MFI) has turned downward from the upper boundary, indicating capital outflows from the asset and weakening buying pressure. This divergence between price action and money flows often precedes short-term corrections.
The Average Directional Index (ADX) at 21.72 shows a neutral trend strength, suggesting the market lacks strong directional conviction at current levels. The Williams %R and CCI indicators also provide neutral readings, reinforcing the consolidation theme.
Fibonacci Retracement Analysis
The Fibonacci retracement levels applied from the recent peak of $5,602 down to the low of $4,405 provide critical reference points. Gold has recovered and is currently trading above the 38.2% retracement level at $4,654, which has held as support since February 5.
The 50% retracement level, which was tested during the extreme intraday low on February 2, has now transitioned to a support zone. The current price action suggests gold is consolidating between the 38.2% and 50% retracement levels before attempting to challenge higher Fibonacci targets.
The 78.6% Fibonacci retracement at $5,340 represents the next major bullish target if the uptrend resumes, aligning with the Gartley pattern projection.
Chart Pattern Analysis
Gold is trading within a bullish channel on the daily timeframe, with the recent correction representing a normal retracement within this pattern. A rebound from the lower boundary of this bullish channel would provide additional confirmation for resuming the uptrend.
The price structure suggests XAU/USD is on the C-D leg of a Gartley harmonic pattern, aiming for the 78.6% Fibonacci retracement level near $5,340. This advanced pattern suggests a measured upside target once the current consolidation phase completes.
Fundamental Analysis
US Dollar Dynamics
The inverse relationship between US dollar strength and gold prices remains the dominant fundamental driver in February 2026. The dollar's appreciation following the Warsh nomination created immediate headwinds for gold, as the precious metal is priced globally in US dollars.
Recent dollar weakness from multi-week lows on February 9-10 supported gold's surge past $5,000. However, the dollar has edged higher in recent sessions, contributing to the current consolidation and slight pullback in gold. Any sustained extension in dollar strength would likely prolong downside pressure on XAU/USD.
Interest Rate Expectations
Real interest rates—nominal rates adjusted for inflation expectations—represent the key fundamental driver of gold pricing. The market has reassessed Fed policy expectations following the Warsh nomination, leading to higher real rate projections across the yield curve.
However, this narrative shifted dramatically with weak US economic data released on February 10-11, causing Treasury yields to collapse and providing substantial support for gold. Market participants currently anticipate at least two rate cuts of 25 basis points each in 2026, with the first expected in June.
Non-yielding gold typically performs well in environments of low interest rates and accommodating monetary policy. Fed easing creates a dual tailwind for gold through lower real yields and via denomination effects from a weaker dollar.
Geopolitical Risk Premium
Heightened geopolitical tensions are providing critical safe-haven support for gold in February 2026. US-Iran tensions escalated significantly after President Trump warned of military intervention and confirmed an "armada" heading toward Iran. The USS Abraham Lincoln aircraft carrier and accompanying fleet are currently nearing Iranian waters.
Iran's Revolutionary Guard Commander stated that Iran has its "finger on the trigger," while Supreme Leader Ayatollah Ali Khamenei has reportedly been moved to an underground fortified shelter in Tehran. These developments have accelerated safe-haven demand for gold as investors seek protection against potential military conflict.
Additional geopolitical factors include Venezuelan oil sanctions and blockades, which have resurfaced as market concerns. These combined geopolitical risks support a bullish case for gold as a wealth preservation asset.
Economic Data & Market Sentiment
Weak US economic data has been instrumental in supporting gold's recovery above $5,000. November payrolls rose by only 64,000, while revisions to previous months showed the labor market shed an additional 33,000 jobs.
Investors are keenly awaiting January nonfarm payrolls data and inflation figures to gain further insight into the Federal Reserve's monetary policy trajectory. These upcoming data releases represent critical catalysts that could determine whether gold's current consolidation leads to a breakout or breakdown.
Market sentiment remains cautiously optimistic, with aggressive dip-buying following the late-January correction demonstrating strong underlying demand. Central bank purchasing continues to provide structural support for gold at elevated price levels.
Trading Signal for February 13, 2026
Signal: BUY on Dips (Tactical Long Position)
Confidence Level: 75%
Trade Setup
Entry Strategy:
- Primary Entry Zone: $4,925-$4,945 (Current price to immediate support)
- Secondary Entry Zone: $4,900-$4,920 (Enhanced risk-reward on deeper dip)
Stop Loss:
- Conservative: $4,795 (Below critical support at $4,805)
- Aggressive: $4,840 (Tighter stop for active traders)
Take Profit Targets:
- TP1: $5,000 (Immediate resistance, psychological level) - Book 30% profits
- TP2: $5,100 (Near-term resistance) - Book 40% profits
- TP3: $5,165-$5,170 (Critical breakout level) - Book 20% profits
- TP4: $5,340-$5,385 (Extended target if breakout confirmed) - Hold remaining 10%
Risk-Reward Ratio: Approximately 1:2.5 to 1:4 depending on entry and targets
Trade Rationale
The bullish bias is supported by multiple converging factors. Gold remains within an intact bullish channel and is trading above key moving averages, suggesting the correction is temporary within a broader uptrend. The forecast specifically anticipates a test of support near $4,945 before an upward rebound continuation.
Fundamentally, collapsing Treasury yields, weak economic data, and elevated geopolitical risks create a supportive environment for gold. The recent 15.7% correction from all-time highs has flushed out speculative positions, creating a healthier technical foundation for the next leg higher.
Technical indicators show neutral-to-bullish momentum with RSI at 55-61 and MACD above zero, providing room for upside movement. The Fibonacci retracement structure suggests gold is consolidating between 38.2% and 50% levels before targeting the 78.6% retracement at $5,340.
Risk Factors
Several risk factors could invalidate the bullish scenario. A decisive break below $4,805 would signal continuation of the decline toward $4,525-$4,550 and require immediate position closure. Sustained US dollar strength driven by hawkish Fed policy expectations would create persistent headwinds for gold.
Additional risks include resolution of geopolitical tensions reducing safe-haven demand, stronger-than-expected US economic data supporting higher interest rates, and technical failure at the $5,000 resistance zone. The mild bearish MACD histogram and overbought Stochastic readings suggest short-term vulnerability to further correction.
Alternative Scenario: Bearish Breakdown
Trigger: Break and close below $4,805
Short Entry: $4,795-$4,800
Stop Loss: $4,860
Target 1: $4,655 (38.2% Fibonacci support)
Target 2: $4,550-$4,595 (Major support zone)
Target 3: $4,525 (Extended downside target)
This bearish scenario would gain credibility if accompanied by surging dollar strength, hawkish Fed rhetoric, or de-escalation of geopolitical tensions.
Position Sizing & Risk Management
For this XAU/USD trade setup, proper position sizing is essential given the elevated volatility demonstrated in January-February 2026. With the stop loss at $4,795 and entry around $4,935, the risk per trade represents approximately 140 points or 2.8%.
Conservative traders should risk no more than 1-2% of total trading capital on this position. Using a $4,935 entry with a $4,795 stop loss, a 1% account risk would translate to approximately 0.36 micro lots per $10,000 account.
Aggressive traders with higher risk tolerance might consider 2-3% risk allocation, but should implement partial profit-taking at each target level to manage exposure as the trade develops. Trailing stop losses should be employed once the trade moves into profit, particularly after TP1 at $5,000 is achieved.
Time Horizon & Trade Management
This trade setup targets an intraday to swing timeframe of 1-5 days based on the forecast analysis for February 13, 2026. The initial support test at $4,945 and subsequent rebound could develop within 24-48 hours.
Active traders should monitor the US economic data releases scheduled for this week, particularly nonfarm payrolls and inflation figures, as these represent high-impact catalysts that could accelerate price movement. Positions should be reduced ahead of major data releases if trading with shorter timeframes.
For swing traders, holding positions through the consolidation phase toward the $5,165-$5,170 breakout level represents a 2-4 day timeframe based on recent volatility patterns. Once TP2 at $5,100 is achieved, consider moving stops to breakeven to eliminate risk.
Market Correlation Considerations
Gold's correlation with other asset classes provides additional context for trade management. The inverse relationship with the US Dollar Index (DXY) remains highly significant, with correlation coefficients typically exceeding -0.70. Traders should monitor DXY price action for confirmation of XAU/USD directional moves.
Treasury yields, particularly real yields adjusted for inflation expectations, maintain a strong inverse correlation with gold. The recent collapse in Treasury yields has been a primary driver of gold's recovery above $5,000. Monitoring 10-year Treasury yields provides valuable leading indicators for gold direction.
Precious metals mining stocks, such as those tracked by Wheaton Precious Metals Corp (WPM), often provide confirmation of gold trends, though with amplified volatility. WPM declined 6.67% on February 12, suggesting some profit-taking in the gold sector.
Conclusion & Final Recommendation
The technical and fundamental confluence supports a tactical BUY on dips strategy for XAU/USD on February 13, 2026, with 75% confidence. The analysis suggests an attempt to test support near $4,945 before resuming the uptrend toward $5,100-$5,385.
The broader context shows gold recovering from an extreme correction, consolidating above key Fibonacci support levels, and benefiting from multiple fundamental tailwinds including weak economic data, collapsing yields, and elevated geopolitical tensions. However, traders must remain vigilant regarding the critical $4,805 support level, as a break below would invalidate the bullish scenario.
Implement proper risk management with position sizing aligned to account size, use tiered take-profit targets to capture gains incrementally, and adjust stops to breakeven once the trade moves favorably. The current consolidation phase presents an attractive entry opportunity for traders seeking exposure to gold's medium-term bullish outlook.
Disclaimer: This analysis is for educational purposes only and should not be considered financial advice. Trading forex and commodities involves substantial risk of loss and may not be suitable for all investors. Always conduct your own research and consult with a licensed financial advisor before making trading decisions. Past performance does not guarantee future results.