
XAU/USD Full Market Analysis & Trading Signal — Friday, March 13, 2026
⚡ Live Price Check
As of 01:00 AM GMT, March 13, 2026, XAU/USD is trading at approximately $5,088–$5,109 per ounce, a sharp decline from the previous close of $5,176.20–$5,177.17 — a loss of approximately $68–$88 (-1.3% to -1.82%) within the opening hours of the Asian session. The 52-week high stands at $5,598.88 and the 52-week low at $2,956.84, giving a sense of the extraordinary rally gold has staged over the past year.
📊 Price Action Context (Recent Daily Candles)
Understanding where we are today requires reading the last 5 sessions precisely:
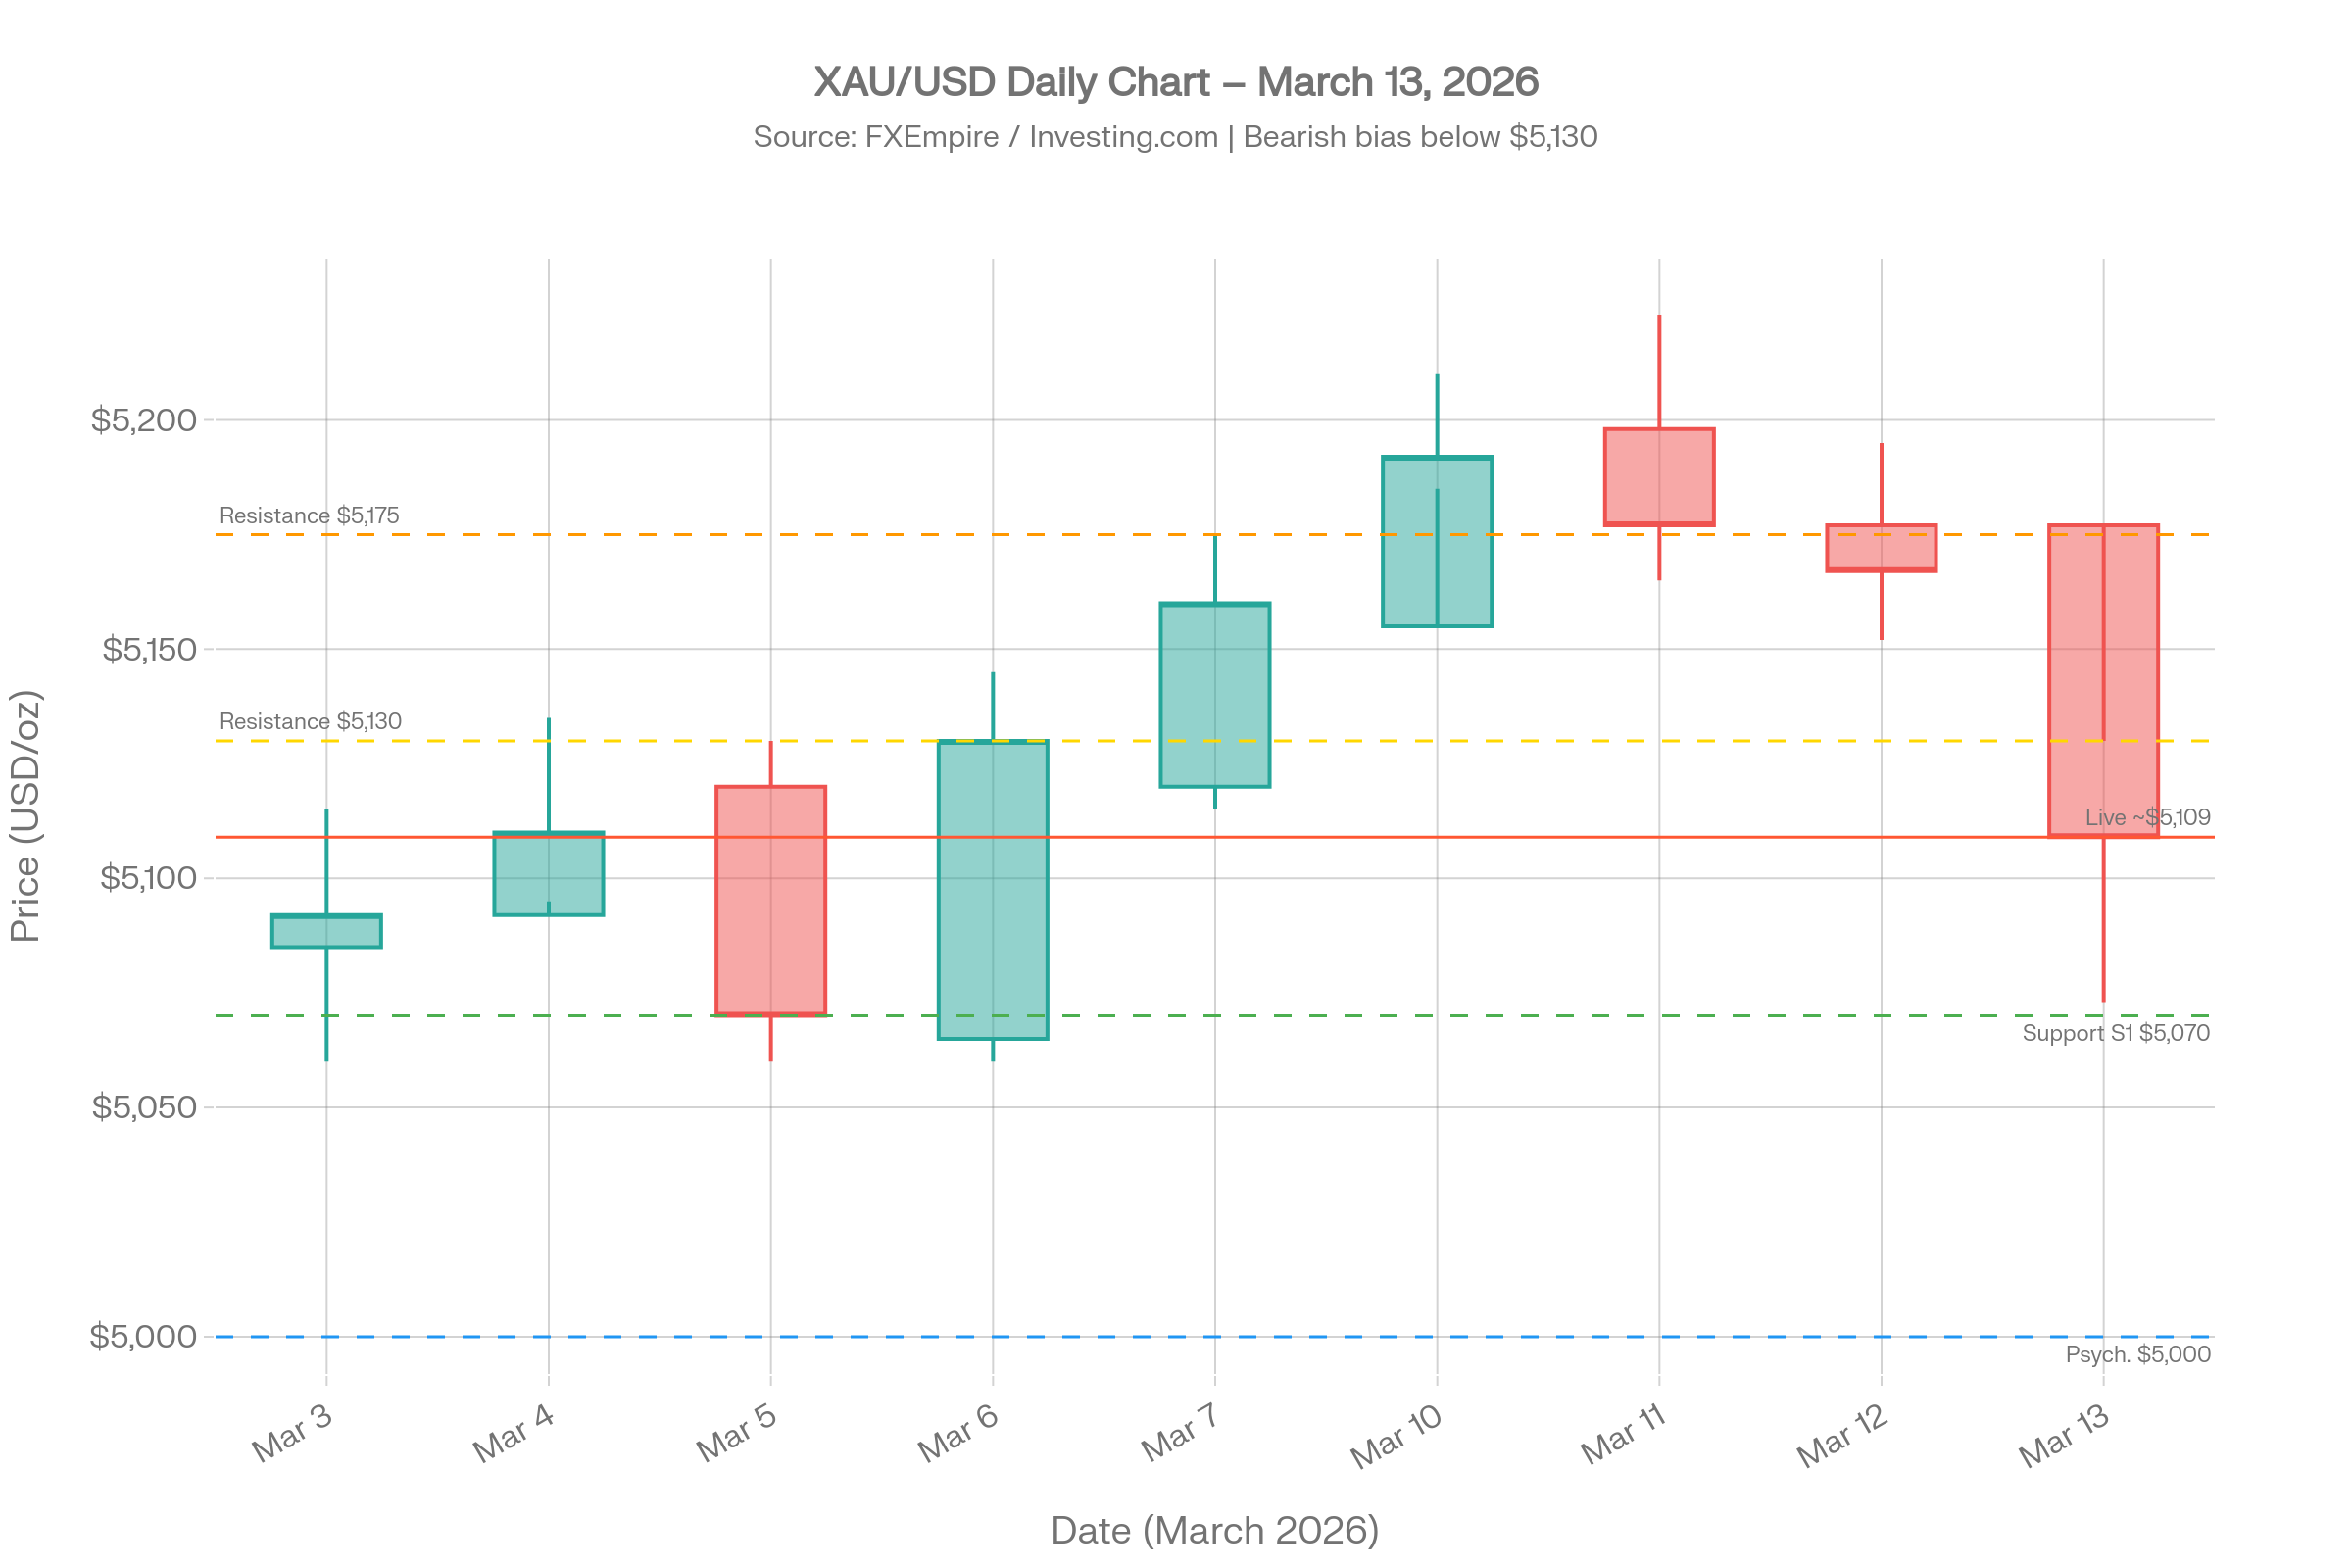
- March 10: Gold closed at $5,192.92 — a strong bullish day pushing toward the upper range
- March 11: Opened at $5,198.00, touched a high of $5,223.30, but reversed and closed at $5,177.50 (-0.40%) after US CPI data was released — a reversal signal
- March 12: Gold opened at $5,176.20, traded between $5,152–$5,195, and showed a consolidation pattern but failed to recover above $5,200 as rising Treasury yields and a stronger USD created headwinds
- March 13 (Today): Opened sharply lower near $5,073–$5,109, printing a bearish gap-down from the previous close — the most decisive bearish candle of the week
The three-day pattern of lower highs and lower closes since March 11 constitutes a short-term bearish swing that is now pressuring a critical structural support zone.
🔧 Multi-Indicator Technical Deep Dive
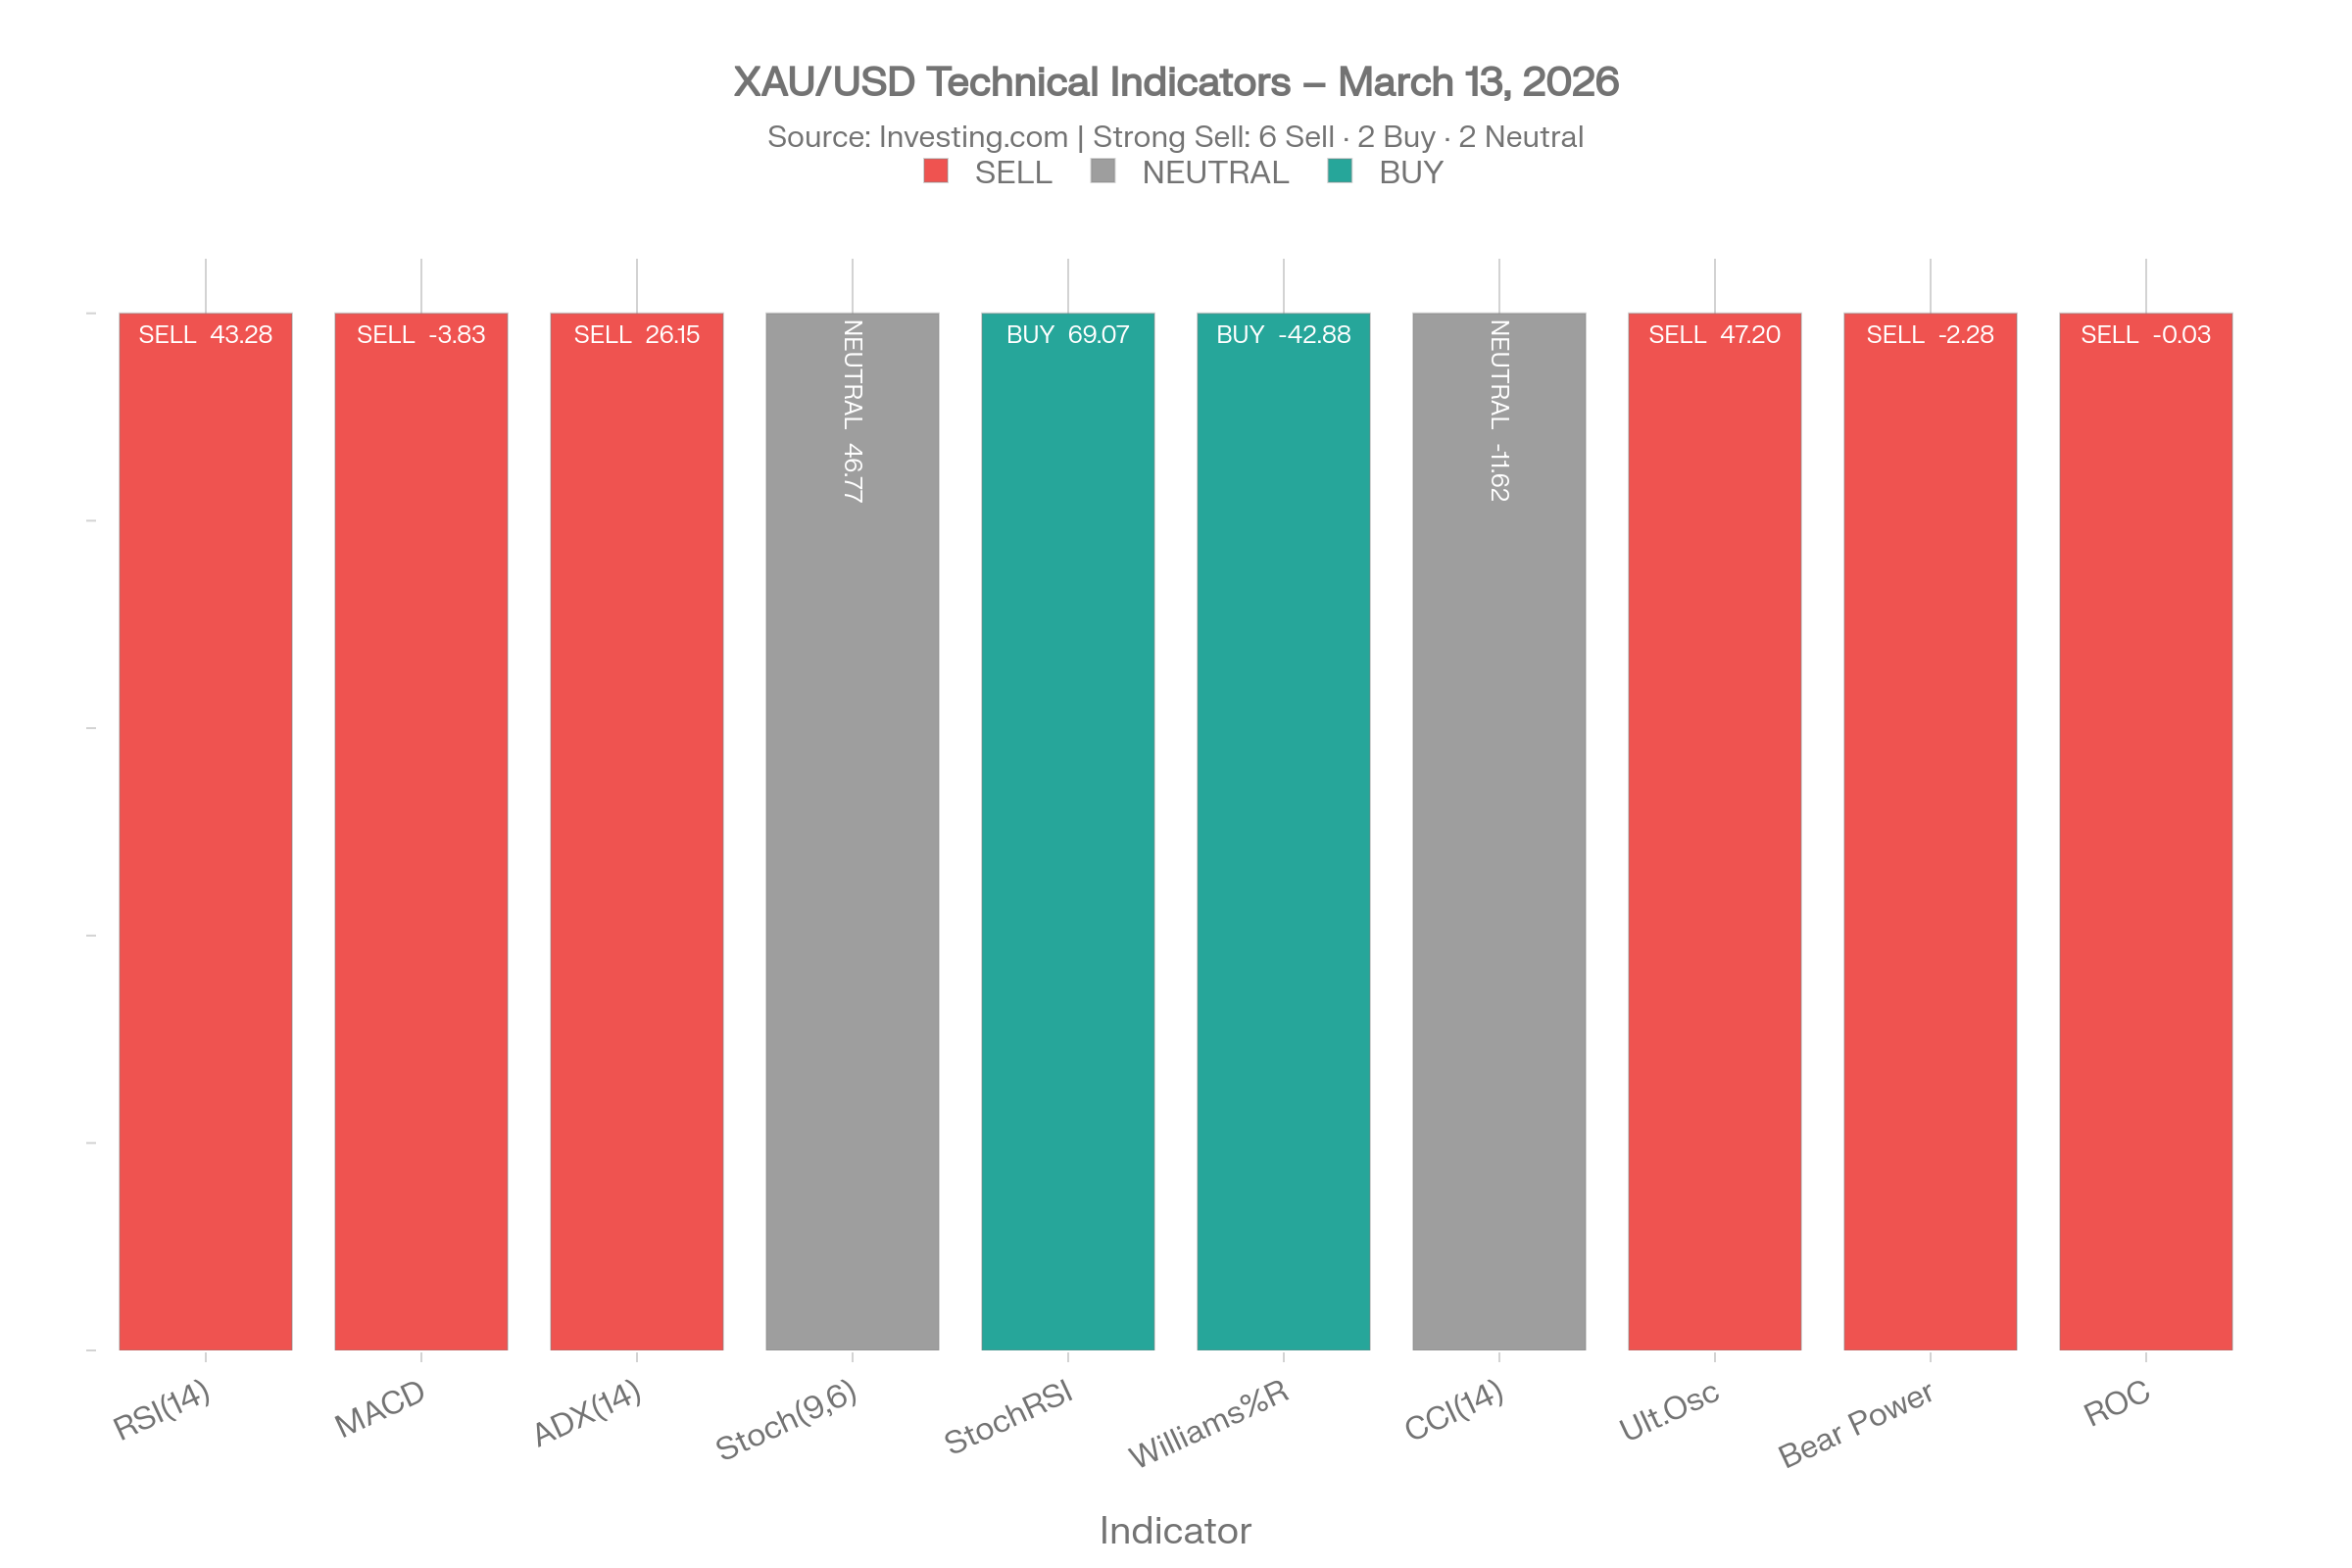
The technical picture on the daily chart is dominated by bearish signals, with 6 out of 10 key indicators reading SELL as of market open on March 13:
Momentum Indicators
| Indicator | Value | Signal |
|---|---|---|
| RSI (14) | 43.28 | SELL — approaching oversold threshold |
| MACD (12,26) | -3.83 | SELL — negative histogram, bearish momentum |
| ADX (14) | 26.15 | SELL — moderate trend strength confirmed |
| Stochastic (9,6) | 46.77 | NEUTRAL — no clear direction |
| Stochastic RSI (14) | 69.07 | BUY — slight counter-trend signal |
| Williams %R | -42.88 | BUY — nearing oversold zone |
| CCI (14) | -11.62 | NEUTRAL |
| Ultimate Oscillator | 47.20 | SELL |
| Bull/Bear Power (13) | -2.28 | SELL — bears in control |
| ATR (14) | 7.09 | Lower Volatility — compression may precede move |
The RSI at 43.28 moving downward is particularly significant — it confirms momentum is bearish but not yet in oversold territory (below 30), meaning more downside remains possible before a technical bounce is warranted. The MACD at -3.83 is firmly in sell territory with the histogram still negative, indicating no momentum reversal yet.
Moving Average Analysis
| Moving Average | Level | Position vs Price |
|---|---|---|
| EMA (50) | ~$5,188 | Price is BELOW (bearish) |
| EMA (200) | ~$5,159 | Price is BELOW (bearish) |
| 20-Day SMA | ~$5,175 | Price is BELOW (bearish) |
| 50-Day SMA | ~$5,061 | Price is ABOVE (long-term bullish) |
| 200-Day SMA | ~$4,314 | Price is FAR ABOVE (structural bull) |
Price is currently trading below both the EMA(50) and EMA(200), which is the most critical short-term bearish signal of all. However, the Golden Cross remains intact (EMA50 > EMA200 on longer timeframe), confirming the multi-month uptrend has NOT reversed — today's action is a correction within a larger bull market.
🗺️ Key Support & Resistance Levels
These are the exact price zones to watch for today's session:
| Level | Price | Significance |
|---|---|---|
| Resistance 3 | $5,243.00 | Major resistance from FXLeaders — must break for rally continuation |
| Resistance 2 | $5,175.00 | Previous close / prior support turned resistance |
| Resistance 1 | $5,125–$5,130 | Key area for sell entries on bounce |
| Pivot | $5,107–$5,109 | Current price zone / intraday pivot |
| Support 1 | $5,070–$5,075 | Critical floor (double-bottom zone from fx.co analysis) |
| Support 2 | $5,052 | Secondary demand level |
| Psychological | $5,000 | Major psychological floor — institutional target |
The $5,070–$5,100 zone is the most important level of the day. Multiple technical analysts have identified this as the double-bottom neckline support area, and a confirmed break below $5,070 would open a rapid move toward $5,000.
🌐 Macro & Fundamental Drivers for March 13
Gold is not falling in a vacuum — three primary macro forces are pressing prices lower today:
1. US Dollar Strength & Treasury Yields Rising
The resurgent US Dollar Index is creating direct headwinds for dollar-denominated gold. Rising US Treasury yields reduce the appeal of non-yielding assets like gold, as the opportunity cost of holding it increases.
2. US CPI February Data (Released March 12)
The US Consumer Price Index for February came in at +0.3% month-on-month and 2.4% year-on-year — above the Federal Reserve's 2% target. This has pushed markets to price in only one 25 bps rate cut for the entirety of 2026, a significant hawkish revision from earlier expectations of multiple cuts. Fewer rate cuts = a stronger USD = downward pressure on gold in the short term.
3. Oil at $87/Barrel & Middle East Tensions
Brent crude near $87/barrel is a double-edged sword for gold: it fuels inflation fears (which are normally gold-positive) but also increases the probability of sustained high rates (gold-negative). The ongoing US-Iran-Israel conflict including tanker attack incidents remains a wildcard for safe-haven demand.
4. Central Bank Buying (Structural Floor)
The People's Bank of China (PBoC) has been buying gold for 16 consecutive months, and total official central bank purchases were approximately 850 tonnes in 2025. This structural demand provides a floor and prevents deeper sell-offs even during corrections.
🌊 Elliott Wave & Pattern Analysis
From an Elliott Wave perspective, gold completed Wave I from the $2,855 low all the way up to the $5,595–$5,598 high — a massive five-wave impulse structure. The current decline is classified as Wave II correction from the $5,598 peak, which typically retraces 38.2%–61.8% of Wave I. The 38.2% Fibonacci retracement of that Wave I move sits near $5,050, providing confluence with the $5,000–$5,070 support cluster. A double-bottom pattern is forming around the $5,100 area on the H4 timeframe, with the neckline at $5,200; a successful bounce and break above $5,200 would confirm the pattern with an initial target of $5,400.
🚦 Trading Signal — March 13, 2026
PRIMARY SIGNAL: SELL (Bearish Bias)
Confidence Level: ~68%
Strategy: Wait for a relief bounce to the $5,120–$5,130 resistance zone and sell the rally.
| Parameter | Level |
|---|---|
| Direction | SELL |
| Entry Zone | $5,120 – $5,130 (on bounce to resistance) |
| Stop Loss | $5,158 (above EMA 200 cluster) |
| Take Profit 1 | $5,073 (S1 / double-bottom zone) |
| Take Profit 2 | $5,025 (near S2) |
| Risk/Reward Ratio | ~1:2.3 |
Rationale: Price is below EMA(50) and EMA(200), MACD is in negative territory, RSI at 43 has room to fall further, and the daily candle structure is showing consecutive lower highs and lower closes since March 11. A bounce to $5,125–$5,130 would likely fail as the EMA cluster at $5,159–$5,188 creates a formidable overhead resistance ceiling.
ALTERNATIVE SIGNAL: BUY (Contrarian Bounce Play)
Confidence Level: ~45%
Strategy: Buy at the double-bottom support zone if price shows bullish reversal confirmation (hammer candle, bullish engulfing, or RSI divergence).
| Parameter | Level |
|---|---|
| Direction | BUY |
| Entry Zone | $5,073 – $5,085 (double-bottom support, only on confirmation) |
| Stop Loss | $5,053 (below structural support) |
| Take Profit 1 | $5,130 (R1) |
| Take Profit 2 | $5,155 (EMA 200 zone) |
| Risk/Reward Ratio | ~1:1.8 |
Rationale: The Williams %R approaching oversold, StochRSI giving a buy signal, and the strong double-bottom structural support at $5,070–$5,100 make a technical bounce possible. However, do NOT enter this trade without a clear reversal candlestick pattern as confirmation — entering into a falling knife risks being trapped.
📅 Economic Calendar Risk for Today
| Time (GMT) | Event | Expected Impact |
|---|---|---|
| All Day | US-Iran geopolitical developments | HIGH — Safe-haven wildcard |
| Ongoing | US Treasury yield movements | HIGH — Inverse correlation |
| Ongoing | USD Index (DXY) direction | HIGH — Direct inverse driver |
🏦 Institutional Forecasts (Context Only — Not for Day Trading)
Major financial institutions remain structurally bullish on gold, which confirms the macro tailwind beneath today's correction:
- JPMorgan: $6,300/oz by end-2026 (raised from $5,055 in February 2026); upside scenario $8,000+
- Goldman Sachs: $5,400 year-end with "significant upside risk"
- UBS & Deutsche Bank: $6,000–$6,200 mid-to-late 2026 targets
- World Gold Council: 5–15% additional gains if rates ease; 15–30% upside in a major downturn scenario
⚠️ Risk Disclaimer
The primary SELL signal is supported by 6 of 10 technical indicators, confirmed bearish EMA positioning, and a gap-down daily open. However, the structural macro bull case remains intact with central bank buying, geopolitical risk, and inflation acting as floors. Today's critical binary: if $5,070 holds → bounce to $5,130–$5,155 is likely; if $5,070 breaks → fast move to $5,000–$5,025 becomes the dominant scenario. Always use strict risk management and limit position size to 1–2% of capital per trade. This analysis is for educational purposes and does not constitute financial advice.