XAU/USD Deep Analysis & Trading Signal — Thursday, 05 March 2026
📍 Live Price Snapshot — Where Gold Stands Right Now
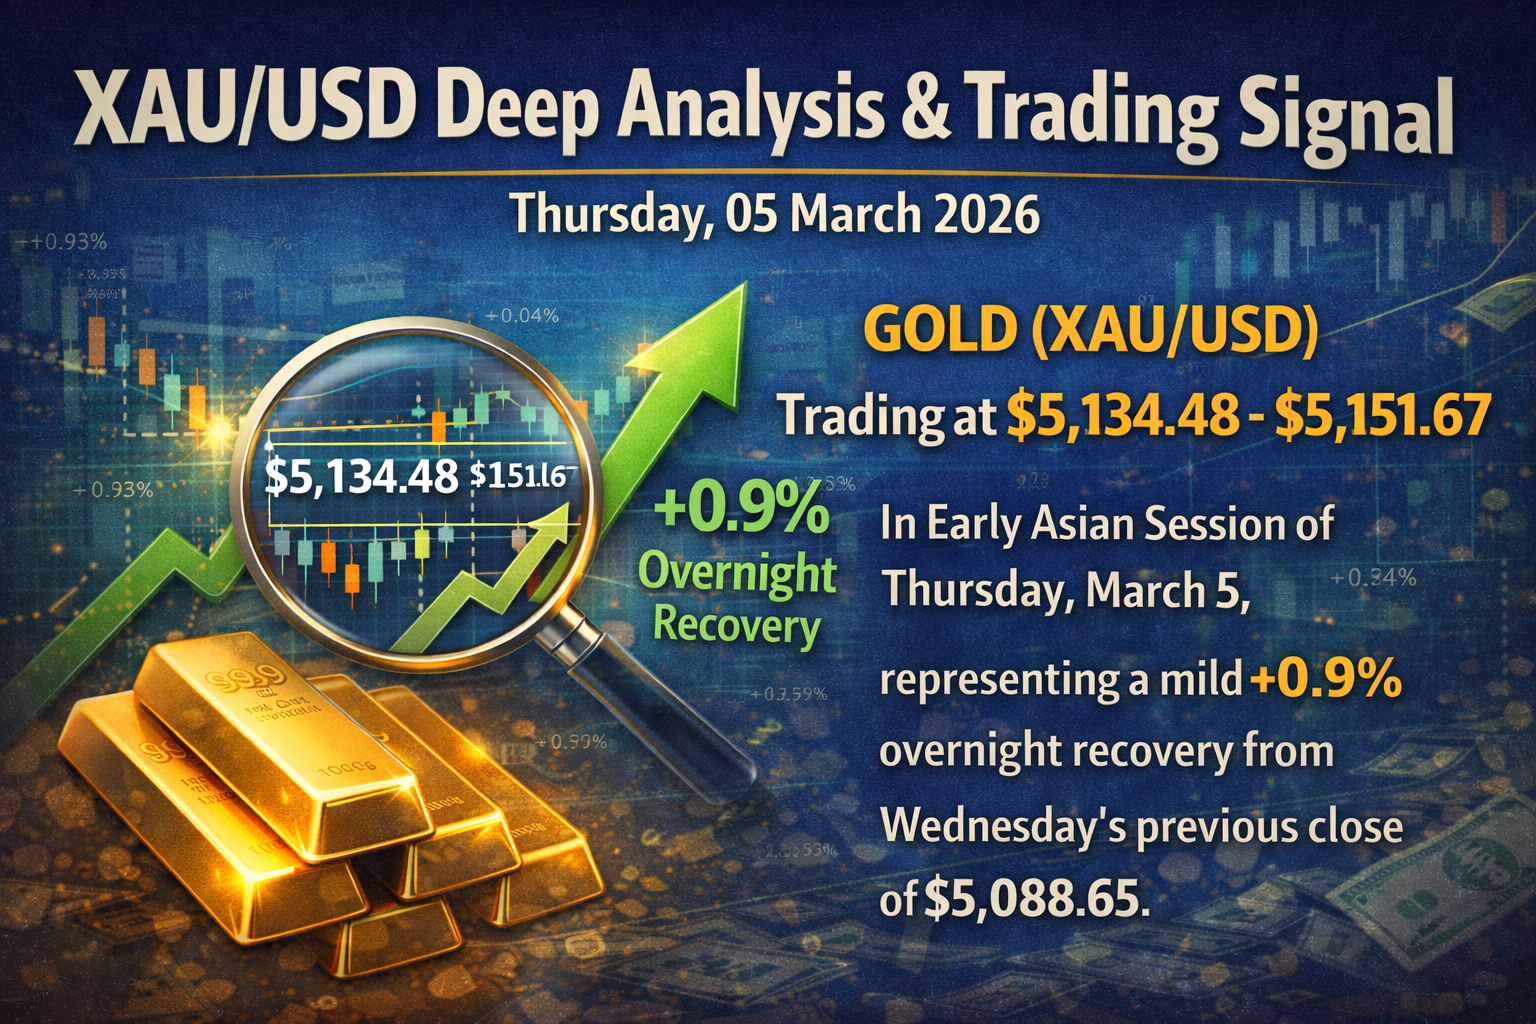
Gold (XAU/USD) is currently trading at $5,134.48 – $5,151.67 in the early Asian session of Thursday, March 5, representing a mild +0.9% overnight recovery from Wednesday's previous close of $5,088.65. The price has been in a quiet, low-volatility recovery since the catastrophic March 3 session when Bloomberg confirmed gold slumped more than 6% — one of the sharpest single-session declines in modern gold market history. Crucially, the $5,095 support level held on March 4, confirming a technical floor that now underpins Thursday's session.
🚨 TRADING SIGNAL — 05 March 2026 (Thursday)
| Signal Parameter | Detail |
|---|---|
| Pair | XAU/USD — Gold Spot / US Dollar |
| Directional Bias | 🟡 CAUTIOUSLY BULLISH — RECOVERING STRUCTURE |
| Primary Signal | 🟢 BUY LIMIT — Buy the Dip into Support |
| Primary Entry Zone | $5,095 – $5,130 (key H4 support confluence) |
| Secondary Signal | 🟢 BUY STOP — Confirmed Breakout Entry |
| Breakout Entry | Above $5,185 (confirmed channel breakout trigger) |
| Stop Loss (Both) | $5,035 (below $5,065 structural floor) |
| Take Profit 1 | $5,205 (first key resistance) |
| Take Profit 2 | $5,280 (major resistance zone) |
| Take Profit 3 | $5,390 (full bull scenario target) |
| R/R Ratio | ~1:5 (Buy Stop scenario per RoboForex) / 1:2.5 (Buy Limit) |
| Signal Confidence | ⭐⭐⭐⭐ HIGH (Multi-source technical confluence) |
| Session Focus | London Open + NY Open |
| Bear Invalidation | 4H candle close below $4,975 |
| Bull Confirmation | 4H candle close above $5,185 |
✅ Signal Summary: Gold has completed its corrective phase after the Monday-Tuesday whipsaw. The $5,095 floor held on March 4, the Stochastic Oscillator has formed a bullish crossover, RSI is at a healthy neutral 61 (not overbought), and Elliott Wave structure confirms Wave (2) correction is complete. Thursday is a controlled re-entry day for bulls — buy the dip, ride the recovery. The full recovery target is $5,390 if $5,185 breaks decisively.
🌍 Fundamental Analysis — The Battlefield Has Shifted
Geopolitical War Premium — Still Active, Now More Nuanced
The Iran conflict that triggered Monday's explosive gold rally remains very much active. Mitrade confirms that gold on Wednesday was "rising for the fifth consecutive day on Middle East tensions and modest USD pullback" — a critical detail. While Tuesday's crash was driven by dollar and yield mechanics overriding the war premium, the underlying geopolitical bid never fully disappeared. The Strait of Hormuz remains contested, Iran has not backed down militarily, and President Trump has pledged a "big wave" of additional strikes.
For Thursday, the geopolitical backdrop functions as a structural safety net — it prevents gold from collapsing through $5,000 even as the macro headwinds (yields, dollar) are present. Every dip toward the $5,000–$5,095 zone is being met with institutional buying from central banks, ETF inflows, and safe-haven demand.
The "Great Divergence" — Gold and Yields Rising Together
Chronicle Journal's deep analysis published March 3 identifies the most important macro structural theme for March 5: gold and 10-year US Treasury yields are rising simultaneously— a historic breakdown of the traditional inverse correlation. The 10-year yield spiked from 3.96% at end-February to 4.107% by March 3. Normally, this would crush gold. Instead, gold is holding at $5,134 — because this time, the yield spike is driven by geopolitical inflation fears (oil shock, Strait of Hormuz) rather than a strong economy. The bond market is pricing in inflationary pressure, not growth — and in that scenario, gold's inflation-hedge value overrides the yield headwind.
This is an extraordinary macro development: it means the traditional "rising yields = sell gold" rule is partially broken in the current environment, and gold's resilience near $5,100+ must be respected even when yields are elevated.
Federal Reserve — "Higher For Longer" Until September 2026
The CME FedWatch tool confirms that the probability of a summer rate cut has now nearly evaporated, with markets bracing for the Fed to maintain its current stance until September 2026 or beyond. This "higher for longer" reality has been fully absorbed by the market during Tuesday's crash. Going into Thursday, this is now a priced-in factor rather than a new negative catalyst — which removes it as a fresh headwind for the session.
The macro calculus for Thursday is therefore: stagflationary environment + active war = gold consolidation above $5,000 with a recovery bias toward $5,280–$5,390 in the near term.
Central Bank Demand — The Invisible Bid
Central banks globally continue to accumulate gold at record paces, with the Chronicle Journal confirming that even amid Tuesday's selloff, "central banks themselves are reportedly increasing their bullion reserves". This institutional demand creates a structural floor that retail selling cannot permanently breach. Every time gold dips toward $5,000–$5,100, central bank buy programs activate — explaining the rapid recovery from $5,095 on March 4.
📊 Technical Analysis — Multi-Indicator Deep Dive
The Recovery Structure — What Wednesday Built
Wednesday's session was architecturally important for Thursday's trade setup. Gold:
- Tested and held the $5,095 key support level
- Rebounded intraday toward $5,157
- Closed quietly, setting up a higher low structure compared to the $5,088 March 3 close
- Is currently building a descending corrective channel that RoboForex identifies as the technical structure from which the breakout trade above $5,175 will emerge
The formation of a higher low at $5,095 (above the original correction point) is a classic first signal that the corrective phase is exhausted and buyers are stepping in at progressively higher prices.
Key Support & Resistance Map for March 5
Stochastic Oscillator — The Session's Most Bullish Signal
RoboForex's confirmed indicator data for Thursday provides the single most bullish technical signal of the day: the Stochastic Oscillator has pulled back to the support line and formed a bullish crossover. Specifically:
- The %K line has crossed above the %D line from an oversold zone — the textbook definition of a Stochastic buy signal
- This configuration directly indicates "growing buying pressure" and "potential for renewed upward momentum"
- Historically, Stochastic bullish crossovers from oversold territory after a sharp correction have a high success rate for initiating a recovery leg
- The Stochastic signal confirms that sellers are exhausted and buyers are re-entering the market
This is the green light for the Buy Stop entry above $5,185 — once price confirms the channel breakout, the Stochastic bullish crossover provides the oscillator confirmation that the recovery leg is genuine.
RSI (14) — The Goldilocks Zone
TipRanks confirms the RSI (14) is at 61.15 — firmly in the "Neutral-Positive" zone. This is the ideal RSI reading for a buy setup:
- Not overbought (below 70): Unlike Monday when RSI was 75+, there is room for a significant move higher before RSI becomes a headwind again
- Not oversold (above 30): The market is not in capitulation — it is a controlled recovery
- Above 50: The balance of momentum remains with buyers
- After Tuesday's >6% crash, RSI rebounding to 61.15 from the oversold depths confirms that buying pressure is reasserting itself systematically
For context, the RSI trajectory from this level toward 70 would correspond to a price move from $5,134 toward approximately $5,280–$5,390 — perfectly aligning with the TP2 and TP3 targets.
MACD — Early Buy Signal
TipRanks confirms MACD stands at 30.20, registered as a "Buy" signal. After Tuesday's histogram collapse to deeply negative territory, MACD is now recovering toward and through the zero line. This zero-line recross on the MACD is one of the most reliable momentum signals in technical analysis, historically indicating the start of a sustained directional move — in this case, upward.
Traders should watch for the MACD histogram to expand positively throughout Thursday's session as confirmation that the recovery is gaining momentum rather than fading.
Bollinger Bands — Post-Volatility Contraction Setup
After Monday-Tuesday's explosive Bollinger Band expansion (the most extreme in months), the bands are now contracting as volatility normalizes. Gold is trading near the lower-to-mid Bollinger Band on the daily chart. This positioning is consistent with a recovery-to-mid-band trade — where price gravitates back toward the 20-day moving average (mid-band) as volatility contracts. The mid-band on the daily chart sits approximately at $5,180–$5,220, which aligns almost exactly with RoboForex's $5,185 breakout trigger and the 38.2% Fibonacci retracement of the crash.
Elliott Wave — Wave (2) Correction Confirmed Complete
FXStreet's advanced technical analysis provides the most structurally important confirmation for Thursday: the corrective cycle is complete. The specific Elliott Wave and Gann analysis states:
- The impulsive exhaustion occurred at $5,596 (all-time high) — a classic Wave 5 top
- A full corrective liquidation into $4,402 completed the A-B-C corrective wave structure
- Price then reclaimed $4,841, shifting market structure "from defensive to constructive"
- The March 3 eclipse window caused a spike into the $5,008–$4,980 zone, which FXStreet specifically predicted would be a structural buy opportunity: "Should price spike into the 5008–4980 zone during this window, it should not be viewed as weakness... such a dip would likely complete a Wave (2) or an internal corrective leg"
- Wave (2) correction is now confirmed complete. The next meaningful move is a Wave (3) impulse higher — historically the longest and strongest wave in an Elliott sequence
This is an extraordinarily powerful technical backdrop for Thursday. The eclipse window has passed, Wave (2) completed at the $5,095 low, and Wave (3) is now beginning — targeting $5,390 first, then $5,500+, and eventually a retest of the $5,596 all-time high.
Moving Average Stack — Bullish Trend Intact at the Macro Level
The fact that the 50-day SMA was successfully defended on March 3–4 is the single most important moving average signal for the week. In a bull market, 50-day SMA tests that hold are invariably buy signals, not sell signals.
Fibonacci Retracement — Internal Recovery Map
Using the March 2 high ($5,419) to March 3–4 low ($5,088) as the measured corrective move:
Gold is currently at $5,134 — just below the 23.6% recovery level. A move above $5,166 confirms the recovery is genuinely underway, and the trade becomes progressively higher-probability as each Fibonacci level breaks.
LiteFinance Daily Projection — The Statistical Range
LiteFinance's model-based forecast for March 5, 2026 provides the following quantitative range:
- Daily Low: $4,996.26
- Daily High: $5,320.89
- Average Price: $5,158.57
- Narrative: "XAU/USD may recover after the recent decline"
This $324 projected range is wide — confirming that volatility remains elevated even as it normalizes from Tuesday's extremes. The midpoint at $5,158 closely matches the current live price ($5,134–$5,151), suggesting the market is fairly positioned heading into Thursday's main sessions. The high at $5,320 represents the bull case maximum for today's session, while the low at $4,996 represents the risk-off scenario if geopolitical de-escalation occurs.
Gann & Time-Price Harmonics — The Eclipse Window Has Passed
FXStreet's Gann analysis specifically flagged March 3, 2026 as an "eclipse window" — a timing point where "volatility is expected to compress before releasing". That window has now passed. The violent compression of Monday's rally followed by Tuesday's crash is textbook eclipse-window behavior in Gann theory. Post-eclipse, the release phase begins — and with Wave (2) confirmed complete, the release should be a new bullish impulse. This adds a time-based confirmation layer to all the other technical signals already pointing upward.
📰 Multi-Source Analyst Consensus for March 5
Consensus: 7 Bullish / 1 Cautious / 1 Bearish-leaning — a clear majority pointing toward recovery and continuation.
🎯 Full Trade Execution Playbook for March 5
SCENARIO A — The Dip Buy (Primary, Highest Probability)
The preferred entry for Thursday focuses on buying gold at the current support zone before the confirmed breakout, leveraging the Stochastic bullish crossover and the Elliott Wave (2) completion.
- Thesis: Gold holds above $5,095–$5,107 support through the Asian and early London session, then launches a recovery during London/NY overlap
- Entry: Buy Limit at $5,105 – $5,130 (two-tranche entry: 50% at $5,130, 50% at $5,107)
- Trigger Confirmation: H1 bullish hammer or engulfing candle at support + Stochastic %K above %D
- Stop Loss: $5,035 (below $5,065 structural floor — hard stop, no exceptions)
- TP1: $5,205 (first resistance — close 35%)
- TP2: $5,280 (major resistance — close 40%)
- TP3: $5,390 (full recovery target — close final 25%)
- R/R: ~1:2.8 to TP3
- Session Window: Asian session accumulation → London Open breakout
SCENARIO B — The Confirmed Breakout Buy (Aggressive)
For traders who prefer to enter on confirmed momentum rather than anticipating the move:
- Thesis: Gold breaks decisively above the descending corrective channel's upper boundary at $5,175–$5,185, confirmed by a 4H candle close above this level
- Entry: Buy Stop at $5,187 (just above the $5,185 breakout trigger)
- Trigger Confirmation: 4H candle close above $5,185 with expanding candle body
- Stop Loss: $5,135 (RoboForex confirmed stop level — below the breakout base)
- TP1: $5,280 (major resistance — close 50%)
- TP2: $5,345 (MQL5 resistance cluster — close 30%)
- TP3: $5,390 (RoboForex primary target — final 20%)
- R/R: 1:5 (RoboForex confirmed)
- Key Note: If price triggers above $5,185 but fails to close the 4H candle above, exit immediately — the false breakout risk is real
SCENARIO C — The Bear Case Safety Playbook (Low Probability but Critical Risk Management)
This scenario activates only if geopolitical de-escalation occurs (ceasefire announcement, diplomatic breakthrough) or if unexpectedly hawkish US economic data is released on Thursday:
- Trigger: 4H candle close below $4,975
- Short Entry: $4,970 (sell stop)
- Stop Loss: $5,075
- TP1: $4,835 (RoboForex alternative target)
- TP2: $4,750 (structural deep support)
- R/R: 1:1.5
- Context: This is a low-probability, high-impact scenario — assign 20% probability to this path given the geopolitical backdrop remaining active
⚠️ Key Risk Factors for March 5
- Ceasefire / De-escalation News: The single largest risk to the bullish case. Any credible peace dialogue between the US, Israel, and Iran immediately unwinds the geopolitical premium. Watch for White House and State Department statements throughout Thursday
- US Economic Data: If any Thursday US macro data release (ISM, jobless claims, or Fed speaker commentary) reinforces the "higher-for-longer" Fed narrative with unexpectedly strong numbers, DXY could spike, adding a headwind to gold's recovery
- Oil Price Feedback Loop: If Brent crude surges further (already up 14% from pre-conflict levels), the stagflation paradox intensifies — higher oil = higher inflation expectations = no Fed cuts = dollar stays strong = gold headwind. Monitor oil closely as a leading indicator for gold direction
- False Breakout Risk at $5,185: The descending corrective channel means that multiple false breakout attempts above $5,175–$5,185 are possible before the real breakout occurs. Do not enter the Scenario B trade without confirmed 4H candle close
- Thin Asian Session Liquidity: Gold is currently trading at $5,134–$5,151 in the Asian session — a period of thin liquidity that can create exaggerated moves. The London Open (7:00 AM GMT) and New York Open (1:30 PM GMT) are when true directional signals will emerge
- Below $4,975 Black Swan: A break below $4,975 would signal that Wave (2) correction is not complete and a deeper Wave (C) toward $4,750–$4,835 is underway. This risk cannot be dismissed entirely given the Fed repricing environment
📅 Key Economic Events Impacting Gold on March 5
| Time (GMT) | Event | Gold Impact |
|---|---|---|
| All Day | Middle East conflict developments | HIGH — direct geopolitical premium driver |
| TBC | Any FOMC member speeches | MEDIUM — rate narrative confirmation |
| TBC | US Jobless Claims (if scheduled) | MEDIUM — labor data affects rate cut odds |
| TBC | Any Strait of Hormuz updates | HIGH — oil/gold correlation |
| 13:30 GMT | NY Open — Volume surge | Key directional signal moment |
📈 Complete Level Summary for March 5
🔎 Thursday in Context — The Bigger Picture
Gold on March 5, 2026 is at a pivotal technical and psychological juncture. The three-day drama of Monday's explosive surge, Tuesday's catastrophic 6% crash, and Wednesday's quiet stabilization above $5,095 has reset the technical picture from overbought euphoria to a healthy, constructive recovery base. The Stochastic bullish crossover, RSI at a clean 61, MACD in buy territory, and the Elliott Wave (2) completion confirmed by FXStreet's Gann analysis all point to the same conclusion: the correction has run its course, and a new bullish impulse is beginning.
The macro backdrop reinforces this. The Fed's "higher-for-longer" stance is now fully priced in (no new negative surprise), the Iran conflict continues to generate institutional safe-haven demand, central banks are still buying, and J.P. Morgan's $6,300 year-end target stands unchanged. As the Chronicle Journal eloquently noted, "the resilience of the gold market suggests that even if yields remain elevated, the hunt for safety has moved beyond the sovereign debt market and into the vaults of the world's oldest currency".
Thursday's session is not about chasing momentum. It is about positioning intelligently at the $5,095–$5,130 support zone, respecting the $5,185 breakout level as the confirmation trigger, and targeting $5,280–$5,390 as the recovery destination — with $5,000 as the non-negotiable risk management floor.
📌 Disclaimer: This analysis is provided entirely for educational and informational purposes only. It does not constitute financial advice, investment recommendations, or any guarantee of trading results. All trading and investment activities carry a significant risk of loss. Never trade with capital you cannot afford to lose. Always apply professional risk management principles and consult a qualified, licensed financial advisor before making any trading or investment decisions.