
XAU/USD Deep Analysis & Trading Signal for February 17, 2026
Current Market Overview
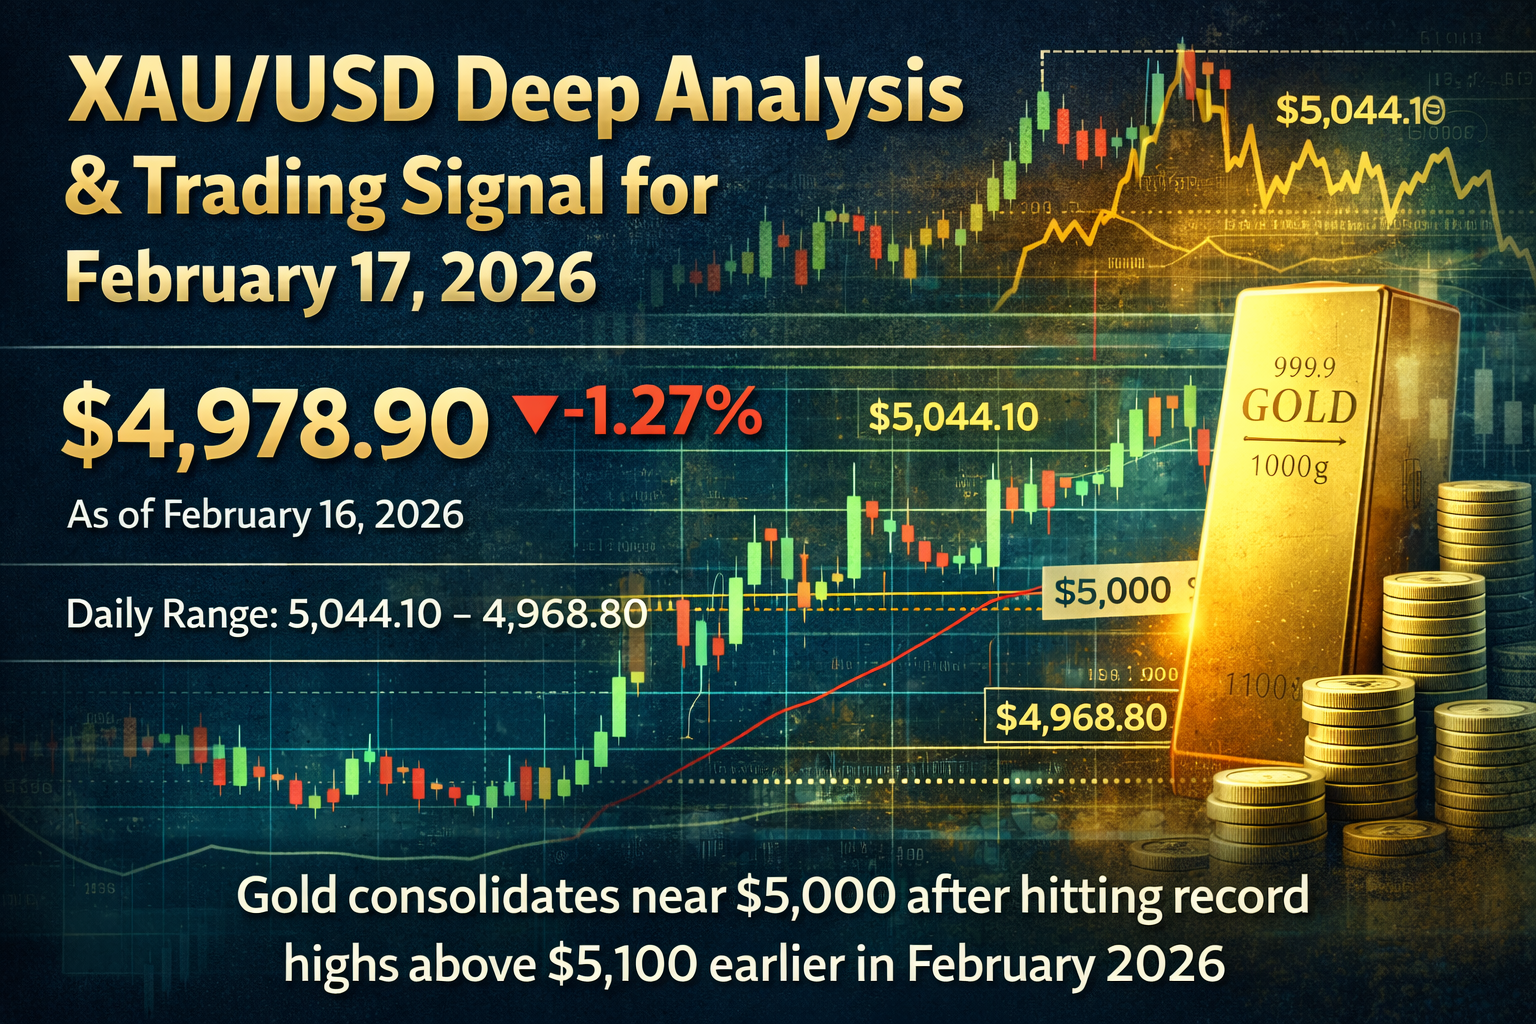
As of February 16, 2026, gold (XAU/USD) closed at $4,978.90, representing a decline of -1.27%from the previous session. The trading session witnessed significant volatility with a daily range spanning from a high of $5,044.10 to a low of $4,968.80. Gold prices have consolidated near the psychologically critical $5,000 level after touching record highs above $5,100 earlier in February 2026.
Technical Analysis Framework
Price Action Structure
Gold is currently exhibiting a ascending triangle pattern on the 4-hour chart, characterized by higher lows and horizontal resistance. This compression structure indicates accumulation and potential energy building for the next directional move. The ascending trendline has been tested three times successfully, demonstrating strong buyer commitment at these levels.
The $5,000 psychological barrier has emerged as the first major resistance zone for any short-term rebound. This round number represents not only psychological significance but also technical confluence with the 1.618 Fibonacci extension from the previous impulse wave.
Key Technical Indicators
Relative Strength Index (RSI - 14 Period):
The RSI currently stands at 40.01, having rebounded from near oversold territory at 30. This recovery indicates improving momentum, though the indicator remains below the neutral 50 threshold. The RSI positioning suggests that gold has absorbed selling pressure and is stabilizing, with room to move higher before reaching overbought conditions. A decisive break above 50 would provide strong bullish confirmation for continuation toward resistance zones.
Moving Average Convergence Divergence (MACD - 12,26,9):
The MACD indicator registers at -0.808, maintaining slightly negative territory but exhibiting fading bearish momentum with a stabilizing histogram. This technical development signals potential for a bullish crossover if buying pressure intensifies. The weakening bearish divergence suggests that sellers are losing control, creating conditions favorable for trend reversal.
Moving Averages:
Price action is interacting closely with the Adaptive Moving Average (20,9,21), with recent candlesticks touching and slightly crossing above this dynamic level. The 21-day Simple Moving Average sits at $4,940.96, providing immediate technical support. Price maintaining above these moving averages indicates the dominant trend remains structurally bullish despite short-term consolidation.
The broader moving average picture shows gold comfortably positioned above key exponential moving averages, with 67.86% of moving average signals indicating bullish conditions.
Critical Support and Resistance Levels
Support Zones:
- Primary Support: $4,950 - This level has established itself as a psychological floor during the recent correction phase and represents immediate demand
- Secondary Support: $4,880-$4,900 - The ascending trendline converges in this area, reinforced by moving average confluence and recent higher lows
- Major Support: $4,845 - Technical analysis identifies this as the next significant target if primary support fails
- Critical Support: $4,800 - Represents the lower boundary of the current consolidation range
- Strategic Support: $4,665 - Weekly forecast analysis suggests this as a potential bearish correction test level
- Deep Support: $4,600-$4,650 - This zone represents a 0.618 Fibonacci retracement of the last impulsive leg combined with a former major high, creating powerful technical confluence
Resistance Zones:
- Immediate Resistance: $5,000 - Critical psychological level acting as initial barrier for any bullish continuation
- Near-term Resistance: $5,020-$5,080 - Local high that must be reclaimed for trend resumption
- Key Resistance Zone: $5,100-$5,120 - This represents a significant supply area with multiple rejections, creating strong horizontal resistance
- Major Resistance: $5,146-$5,200 - Breaking above this level would signal resumption of the primary uptrend
- Extended Target: $5,925 - Weekly forecast suggests this as the potential upside target if bullish structure remains intact
Volume and Momentum Analysis
The recent price decline on February 16 occurred with increasing volume, suggesting genuine selling pressure rather than mere profit-taking. However, the recovery from oversold RSI conditions combined with stabilizing MACD indicates that this selling pressure may be exhausting.
Market structure analysis reveals that moving averages continue signaling an uptrend, with prices having broken above signal lines earlier in the month, indicating sustained buying pressure.
Fundamental Analysis Framework
Federal Reserve Monetary Policy
The Federal Reserve's policy trajectory remains the single most critical variable influencing gold prices. Current market expectations, reflected in CME FedWatch Tool data, anticipate an additional 50-75 basis points of rate cuts through 2026, with the terminal rate expected to settle around 3.50%-3.75%.
Historical analysis demonstrates that a 100 basis point decline in real yields has corresponded to approximately 10-15% increases in gold prices over 12-month periods. With the Federal Reserve transitioning toward a neutral interest rate regime, this creates a structurally supportive environment for gold.
Federal Reserve officials have multiple speaking engagements scheduled around this period, including speeches from FOMC voting members. Any hawkish tone regarding future interest rate policy or persistent inflation could strengthen the US Dollar and pressure gold lower, while dovish commentary would support bullish breakouts.
US Dollar Dynamics
The US Dollar Index (DXY) maintains a historically inverse correlation with gold prices, typically ranging between 73-95% negative correlation. Current market analysis indicates the DXY faces downward pressure as the Fed shifts toward neutral policy.
The 2026 market outlook suggests DXY weakness remains the base case, with potential movement toward the 95.5 level, creating a favorable backdrop for gold appreciation. A stronger dollar makes gold more expensive for international buyers, reducing demand, while dollar weakness enhances gold's relative attractiveness.
Central Bank Gold Demand
Central bank purchasing represents a structural pillar supporting gold prices. Global central banks have accumulated more than 1,000 tonnes of gold annually since 2022, dramatically exceeding the previous decade's average of approximately 600 tonnes annually.
This aggressive accumulation was initially triggered by Russia's invasion of Ukraine and subsequent freezing of Moscow's foreign assets, prompting central banks worldwide to diversify away from US dollar reserves. China's central bank, notably, has continued gold acquisitions for 14 consecutive months through December 2025.
The World Gold Council reports that global gold demand reached a historic quarterly record of 1,313 tonnes in late 2025. This price-insensitive buying from central banks creates a fundamental floor under gold prices, supporting the market during technical corrections.
Geopolitical Risk Premium
Ongoing geopolitical tensions continue providing safe-haven demand support for gold. Multiple flashpoints persist globally, including:
- Tensions between the US and NATO regarding territorial disputes
- Uncertainties surrounding international trade tariffs
- Border hostilities in various regions
- Growing skepticism about US Federal Reserve independence
- Concerns regarding inflated equity markets driving diversification
Analysts note that with US mid-term elections approaching, political instability may further escalate, maintaining elevated safe-haven premiums. Any surprise de-escalation could reduce geopolitical risk premiums, while worsening conditions would likely push gold prices higher.
ETF Flows and Investment Demand
Record inflows into gold-backed exchange-traded funds (ETFs) are providing substantial support amid expectations of further interest rate cuts. As interest rates decline, the opportunity cost of holding non-yielding assets like gold diminishes, increasing investment appeal.
Investment managers note that if the Federal Reserve continues lowering rates through 2026, gold demand should correspondingly increase. This creates a positive feedback loop between monetary policy expectations and investment flows.
Institutional Price Targets
Major financial institutions have revised gold price forecasts upward for 2026, reflecting bullish fundamental drivers:
- JP Morgan: Forecasts gold averaging $5,055/oz by Q4 2026
- Goldman Sachs: Projects gold reaching $5,400/oz by December 2026 (revised from $4,900), citing central bank buying and ETF inflows
- Morgan Stanley: Targets $4,400/oz, viewing gold as a geopolitical risk barometer
- London Bullion Market Association Survey: Experts predict gold could reach as high as $7,150 with an average around $4,742 in 2026
Market Sentiment and Positioning
Current market sentiment reflects a high-level consolidation phase following the strong rally that carried gold from approximately $3,300 to above $5,100. This represents a gain of over 72% compared to the same period last year.
The technical picture has shifted from a strong directional uptrend to a compression and consolidation phase. This is typical behavior after significant rallies, as markets digest gains and await the next fundamental catalyst.
Short-term trading recommendations favor a "sell-oriented approach" during consolidation, while maintaining a "buy-oriented approach" for medium to long-term positioning. This reflects the understanding that while tactical pullbacks may occur, the structural bull market remains intact.
Economic Calendar - February 17, 2026
Based on the economic calendar review, February 17, 2026 does not feature high-impact US economic data releases. However, traders should remain aware of:
- Potential Federal Reserve official speeches that could impact USD and gold
- General market sentiment following recent CPI data releases
- H.10 Foreign Exchange Rates release scheduled
The absence of major economic releases suggests that technical factors and risk sentimentwill likely dominate price action on February 17, rather than fundamental data surprises.
Risk Factors and Considerations
Bullish Risks:
- Stronger-than-expected USD strength from hawkish Fed commentary
- Surprise geopolitical de-escalation reducing safe-haven demand
- Technical breakdown below $4,950 support triggering stop-loss cascades
- Profit-taking from long positions accumulated at lower levels
Bearish Risks (for shorts):
- Unexpected dovish Fed signals accelerating rate cut expectations
- New geopolitical tensions or financial market stress
- Central bank purchase announcements
- Technical breakout above $5,080 triggering momentum buying
Trading Signals for February 17, 2026
Signal #1: Bullish Continuation Setup (PRIMARY SIGNAL)
Entry Strategy: BUY on pullback to support zones
- Optimal Entry Zone: $4,950-$4,980
- Aggressive Entry: Current market price $4,995-$5,000
- Conservative Entry: $4,920-$4,950 (stronger pullback)
Stop Loss: $4,885 (below ascending trendline and moving average support)
Take Profit Targets:
- TP1: $5,045 (2.0% gain) - Previous session high
- TP2: $5,080 (2.6% gain) - Local resistance
- TP3: $5,120 (3.5% gain) - Major resistance zone
- TP4: $5,200 (5.0% gain) - Extended target on strong breakout
Risk-Reward Ratio: 1:2.5 to 1:3.5 (depending on entry)
Position Size Recommendation: 2-3% of trading capital per position
Confidence Level: 75-80%
Technical Justification:
- RSI recovering from oversold territory with room to rise
- MACD showing fading bearish momentum
- Price holding above critical moving averages
- Ascending triangle pattern suggests continuation
- Higher lows indicating buyer commitment
Fundamental Justification:
- Fed rate cut expectations remain supportive
- Central bank buying providing structural support
- Geopolitical tensions maintaining safe-haven premium
- Dollar weakness creating favorable environment
- Institutional targets significantly higher
Signal #2: Breakout Confirmation Setup (AGGRESSIVE)
Entry Strategy: BUY on confirmed breakout
- Entry Trigger: Close above $5,020 on 4H chart with volume confirmation
- Entry Price: $5,025-$5,040
Stop Loss: $4,980 (below breakout level)
Take Profit Targets:
- TP1: $5,080 (1.0-1.5% gain)
- TP2: $5,120 (2.0% gain)
- TP3: $5,200 (3.5% gain)
- TP4: $5,400 (7.5% gain) - Goldman Sachs target
Risk-Reward Ratio: 1:2.5 to 1:4
Position Size Recommendation: 1-2% of trading capital (more aggressive)
Confidence Level: 70% (conditional on breakout confirmation)
Justification:
- Breakout above $5,020 would reclaim the uptrend
- Ascending triangle breakouts typically measure to prior height
- Volume expansion on breakout would confirm buyer strength
- Fundamental backdrop supports higher prices
Signal #3: Range Trading Setup (CONSERVATIVE)
Entry Strategy: SELL at resistance / BUY at support
- Short Entry: $5,020-$5,040 (if reached without breakout)
- Short Target: $4,950-$4,970
- Long Entry: $4,920-$4,950 (on pullback)
- Long Target: $5,000-$5,020
Stop Loss:
- For shorts: $5,085
- For longs: $4,885
Confidence Level: 65% (range-bound scenario)
Justification:
- No major economic events may result in choppy, range-bound trading
- Recent volatility has established clear boundaries
- Suitable for scalping and day trading approaches
Trade Management Recommendations
Position Management:
- Scale into positions rather than committing full size immediately
- Move stop-loss to breakeven once price reaches TP1
- Take partial profits at each target level (25-30% of position)
- Trail stop-loss using 4H ATR or moving averages for remaining position
- Monitor volume - increasing volume on moves higher confirms strength
Time Horizon:
- Intraday: Focus on $4,950-$5,040 range
- Swing Trade: 2-5 day holding period targeting $5,080-$5,120
- Position Trade: Multiple weeks targeting $5,200-$5,400
Volatility and Risk Management
Given recent daily ranges exceeding $75 (1.5% of price), position sizing should account for increased volatility. Use the following guidelines:
- Standard Position: 2% risk per trade
- Volatile Conditions: Reduce to 1-1.5% risk per trade
- Maximum Exposure: Limit total gold exposure to 5-6% of portfolio
- Correlation Awareness: Consider USD positions that may offset gold exposure
Technical Probability Analysis
Probability Scenarios for February 17, 2026:
Bullish Scenario (55% probability):
Gold rebounds from current levels or minor pullback, testing $5,020-$5,080 resistance. Supported by oversold RSI recovery, weakening bearish momentum, and fundamental tailwinds.
Consolidation Scenario (30% probability):
Gold trades sideways in $4,950-$5,020 range as market awaits fresh catalysts. Absence of major economic data supports this scenario.
Bearish Scenario (15% probability):
Gold breaks below $4,950 support, testing $4,880-$4,900 trendline support. Would require unexpected USD strength or risk-off sentiment in equity markets.
Weekly and Extended Outlook
The weekly forecast suggests gold may attempt a bearish correction to test support near $4,665 before resuming upward movement with targets above $5,925. However, this represents a longer timeframe than the immediate daily signal.
The broader technical structure remains bullish with gold positioned within an ascending channel. A breakdown below $4,125 would be required to cancel the upward trend scenario, which appears unlikely given current fundamental support.
Final Trading Signal Summary
PRIMARY RECOMMENDATION: BULLISH
Suggested Action: BUY on pullback to $4,950-$4,980 zone or at current levels $4,995-$5,000
Target: $5,080 (Primary), $5,120 (Secondary), $5,200 (Extended)
Stop Loss: $4,885
Timeframe: 1-3 days (daily chart analysis)
Confidence: 75-80%
Risk-Reward: 1:2.5 to 1:3.5
Key Monitoring Points for Tomorrow:
- Watch for support defense at $4,950-$4,980 zone
- Monitor RSI for move above 50 level (bullish confirmation)
- Look for MACD bullish crossover
- Track USD strength via DXY index
- Note any Fed official commentary
- Observe volume patterns - increasing volume on upward moves confirms strength
Alternative Scenario:
If gold decisively breaks below $4,950 with strong volume, reassess positioning. A move below $4,885 would invalidate the bullish setup and suggest deeper correction toward $4,845-$4,800.
Disclaimer
This analysis is provided for educational and informational purposes only and does not constitute investment advice. Gold trading involves substantial risk of loss and is not suitable for all investors. Market conditions can change rapidly, and past performance does not guarantee future results. Always conduct your own research, implement proper risk management, and consider consulting with a qualified financial advisor before making trading decisions. The confidence levels and probability assessments represent technical analysis opinions based on current data and may not reflect actual future price movements.
Analysis Compiled: February 16, 2026, 19:38 GMT
Valid For: February 17, 2026 Daily Trading Session
Market Reviewed: XAU/USD (Gold Spot vs US Dollar)
Current Price: $4,978.90
This comprehensive analysis integrates multiple technical indicators, fundamental drivers, institutional forecasts, and market structure analysis to provide a well-rounded trading signal for tomorrow's session. The bullish bias is supported by both technical recovery signals and strong fundamental underpinnings, though traders should remain flexible and adjust positioning based on real-time price action and risk management protocols.