XAU/USD Daily Technical Outlook & Trade Signals — 26 February 2026
Introduction
Gold (XAU/USD) enters Thursday's session carrying a confirmed bullish daily structure, a stabilised momentum profile, and a set of clearly defined technical levels that give both intraday and swing traders a precise roadmap for the day ahead. After one of the most volatile five-day stretches in the recent rally — a breakout above $5,200, a sharp single-session rejection from $5,250, and a subsequent recovery — the market is now positioned in a pivotal compression zone where the next meaningful directional move is being decided.
This article provides a full daily technical analysis for 26 February 2026, anchored to the OANDA:XAUUSD feed on TradingView and cross-referenced against institutional sources including Investing.com, FXStreet, Bloomberg, Barchart, and LiteFinance. All levels and signals in this publication are built directly from confirmed daily price data — not estimates or interpolated figures.
Confirmed Daily Price Data — 25 February 2026 (OANDA:XAUUSD, TradingView)
The verified daily candle for the preceding session provides the precise framework from which all levels in this analysis are derived:
| Session Parameter | Level |
|---|---|
| Open | 5,146.80 |
| High | 5,217.84 |
| Low | 5,137.47 |
| Close | 5,172.67 |
| Daily Range | 80.37 points |
Reading this candle precisely: Price opened at 5,146.80, immediately sold off to the session low at 5,137.47 — a 9-point drop from the open — then reversed course entirely and pushed all the way to a session high of 5,217.84. Price subsequently settled and closed at 5,172.67, above the open, above the mid-range, and firmly above the day's worst levels. This is a textbook bullish recovery candle: downside was probed, buyers absorbed every offer at the lows, and the session closed in the upper half of the range. When viewed in the context of the prior day's sharp correction from 5,250, this candle confirms that institutional demand below 5,140 is genuine and active.
Today, 26 February 2026, opens with price in the region of the prior close — approximately 5,170–5,175 in early Asian session trade on TradingView OANDA — just beneath yesterday's high and well above yesterday's low.
Higher-Timeframe Structural Context — The Daily Trend Framework
Before examining today's specific levels, it is essential to understand the macro technical picture that provides the framework for every trade idea in this article.
The February Bull Structure
Gold broke out above $4,550 in January 2026 and has been in a defined bullish trend ever since. The February rally, which began from lows near the $4,800–$4,900 region, has taken price to new multi-week highs above $5,200 — an advance of roughly 8–9% from trough to recent peak. More importantly, the structure of that advance is healthy: each correction has found buyers at a higher level than the last, producing a confirmed sequence of higher highs and higher lows on the daily chart. That sequence remains intact as of today's open.
Moving Average Alignment — Full Bullish Stack
Across all major daily moving average lookbacks, gold continues to trade in a clean bullish configuration. According to current readings from Investing.com and Barchart:
| Moving Average | Approximate Level | Signal |
|---|---|---|
| 200-Day EMA | ~$4,860–$4,880 | ✅ Price well above — structural bull |
| 100-Day SMA | ~$5,020–$5,030 | ✅ Price above — bullish |
| 50-Day SMA | ~$5,040–$5,055 | ✅ Price above — bullish |
| 21-Day SMA | ~$5,050–$5,070 | ✅ Price above — bullish |
| 20-Day SMA | ~$5,060–$5,080 | ✅ Price above — bullish |
Price trading above all major moving averages in sequential order — with each shorter average above each longer one — is one of the most reliable structural confirmation signals in technical analysis. Critically, all of these averages are rising, confirming the trend is accelerating, not decelerating. The 200-day EMA at ~$4,860 represents the ultimate structural anchor: any pullback that does not reach this level must be considered a correction within a bull trend.
RSI (14-Period, Daily) — Optimal Re-Entry Territory
The 14-period RSI on the daily chart has undergone precisely the type of reset that trend traders look for before initiating fresh long positions. Having climbed toward the 73–77 overbought region during the late-February surge, the RSI has since cooled back to approximately the high-50s to low-60s zone following the two-day consolidation. This is technically significant for two reasons. First, it confirms that the momentum engine behind the recent rally is not completely spent — the RSI has not collapsed through 50 into bearish territory. Second, readings in the 58–65 range within an established uptrend consistently correspond to the "reload" phase of a bullish cycle — the market catching its breath before the next leg higher.
MACD (12,26,9 — Daily) — Bullish, Controlled Momentum
The MACD configuration on the daily chart maintains a bullish structure: the MACD line remains above the signal line, both lines remain above the zero axis, and the histogram, while more modest than at the February peak, remains positive. There has been no bearish MACD crossover, no dive below zero, and no momentum divergence visible on the daily timeframe. This configuration is consistent with a bullish trend in a consolidation phase — not with a trend reversal.
ADX (Average Directional Index) — Trend Confirmed, Not a Range
ADX readings in the low-to-mid 20s from Barchart and Investing.com confirm that gold is operating in a genuine directional trend, as opposed to a sideways range. An ADX value above 20 means trend-following strategies are appropriate; an ADX below 20 suggests range-bound approaches instead. The current reading firmly places this market in "trend mode," which means RSI overbought readings are less powerful as reversal signals than they would be in a flat market.
ATR — Elevated Volatility: Manage Risk Accordingly
The 14-period Average True Range (ATR) has been running in the region of 80–150 daily points over the past two to three weeks, reflecting the high-velocity, high-participation environment that has characterised gold's 2026 rally. This elevated ATR has two direct implications for today's traders: stop losses must be placed with sufficient room to allow for normal intraday volatility without triggering premature exits, and position sizes must be scaled accordingly to ensure that a full stop-out represents no more than the trader's pre-defined maximum risk per trade.
Macro & Fundamental Context — Driving Forces Behind Gold's 2026 Bull Market
Technical analysis does not occur in a vacuum. Understanding the macro forces that are driving gold's structural demand is essential for gauging whether dips will be bought and whether breakouts will be sustained.
Trump's 15% Global Tariff Architecture
The executive order implementing a 15% global import tariff on all goods entering the United States remains fully in force with no reversal, negotiation framework, or legal suspension announced. This represents the most significant macro tailwind for gold at present. Tariff uncertainty drives capital flight from risk assets into hard stores of value — and gold is the primary beneficiary. Every day this architecture remains in place is a day that institutional demand for gold as a hedge is structurally reinforced.
JPMorgan's $6,300 Price Target — Institutional Demand Anchor
In the 48 hours preceding this analysis, JPMorgan — one of the world's most systemically important financial institutions — raised its 2026 gold price target to $6,300, with an explicit scenario built for $8,000. This type of bank-level revision does not generate a single day of buying. It generates weeks and months of systematic portfolio reallocation as fund managers, family offices, sovereign wealth funds, and institutional desks re-calibrate their gold exposure. The resulting buy-side pressure creates a structural bid beneath every meaningful pullback.
Central Bank Demand — A Non-Negotiable Floor
Global central banks continue purchasing gold at historically elevated rates, driven by the structural de-dollarisation trend that has accelerated since 2022. This sovereign-level demand means there is always a body of price-insensitive institutional buyers ready to absorb corrections — one of the key reasons that pullbacks in this environment have been shallow and short-lived.
Geopolitical Risk Premium
Ongoing geopolitical uncertainty — including active Iran nuclear developments and elevated US-China trade tensions — continues to embed a war premium into gold pricing. These risks do not resolve overnight and continue to provide background safe-haven support.
Full Level Architecture for 26 February 2026
All levels below are anchored to the TradingView OANDA daily candle data confirmed above.
Resistance Zones
| Level | Significance |
|---|---|
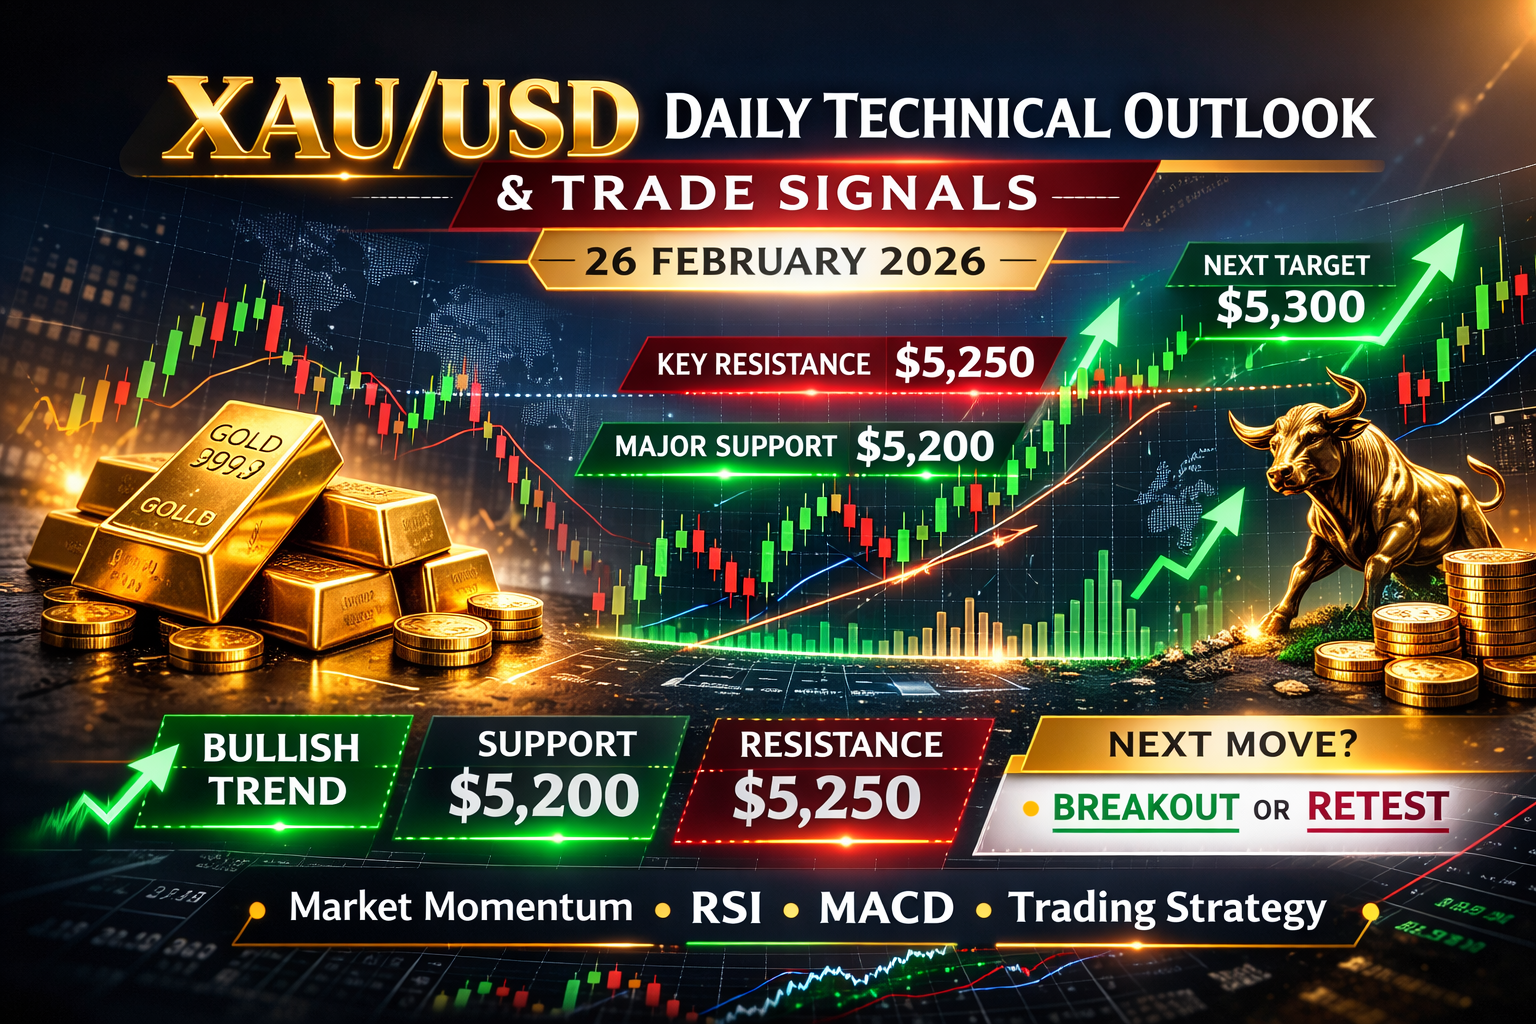
| 5,217–5,220 | 🔴 Immediate resistance — yesterday's daily high. The most critical short-term ceiling. |
| 5,245–5,250 | 🔴 Recent spike high from earlier this week — the near-term structural ceiling on the daily chart. |
| 5,290–5,320 | 🔴 Institutional extension zone — LiteFinance's model daily high for 26 Feb is 5,320.89. Reachable only if 5,250 breaks convincingly. |
| 5,345–5,400 | 🔴 Major bull targets — FXEmpire and Goldman Sachs year-end milestones. |
Support Zones
| Level | Significance |
|---|---|
| 5,160–5,172 | 🟡 Intraday pivot — yesterday's close area. First "decision zone" for the London session open. |
| 5,137–5,145 | 🟠 Yesterday's daily low and confirmed demand zone. The first real line of defence for bulls today. |
| 5,100–5,115 | 🔴 Critical — Fibonacci retracement cluster and prior tested demand zone. Loss of this zone on a daily close would be the first genuine structural warning. |
| 5,050–5,080 | 🔵 Deep support — confluence of rising 20/21-day SMAs, Bollinger Band midline. "Deep but still bullish" correction zone. |
| 4,860–4,880 | 🔵 200-day EMA — ultimate structural bull floor. Any price above this remains in a macro bull trend. |
Calculated Pivot Points for 26 February 2026
Derived from yesterday's OANDA session (H: 5,217.84 / L: 5,137.47 / C: 5,172.67):
| Pivot Level | Price |
|---|---|
| R2 | ~5,278 |
| R1 | ~5,225 |
| Classic Pivot (PP) | 5,176 |
| S1 | ~5,132 |
| S2 | ~5,079 |
The classic pivot at 5,176 is almost precisely where price is trading at today's Asian session open — making this one of the most directly relevant pivot levels of any day this week. A sustained hold above 5,176 is technically bullish; a rejection back below it would signal short-term weakness toward S1 at ~5,132.
Model-Based Range for 26 February 2026 (LiteFinance Quantitative Forecast)
| Metric | Projected Level |
|---|---|
| Expected Daily Low | 5,052.87 |
| Expected Daily High | 5,320.89 |
| Statistical Mean for the Day | 5,186.88 |
| Narrowed Probability Range | 5,153–5,208 |
The model's "centre of gravity" for today at 5,186.88 sits approximately 14 points aboveyesterday's close of 5,172.67, and within the resistance-turned-support zone of 5,180–5,190. This modest upward skew in the model mean is consistent with a mildly bullish day where price oscillates around familiar levels before a directional catalyst drives the next leg.
Scenario Analysis — 26 February 2026
🟢 Scenario 1: Bullish Continuation (Probability: ~55%)
Condition: Price holds above the 5,137–5,140 support zone on a daily closing basis and breaks above the 5,217–5,220 resistance ceiling.
After yesterday's bullish recovery candle demonstrated active institutional buying below 5,140, and with all major moving averages sloping upward, the path of least resistance remains higher. A session where early dips into 5,160–5,172 are bought, followed by a steady grind back toward yesterday's high at 5,217–5,220, would be entirely consistent with the trend.
A clean 4H or daily close above 5,220 — especially on accelerating volume — would signal a resumption of the earlier breakout and activate upside targets of 5,250 and, on a continuation basis, 5,290–5,320.
🟡 Scenario 2: Range Consolidation Between 5,137 and 5,220 (Probability: ~30%)
Condition: Price oscillates between yesterday's low (5,137.47) and yesterday's high (5,217.84) without decisively breaking either boundary.
After an intense stretch of daily volatility, markets often enter a "time correction" phase — where price digests prior gains without extending them. A day where gold trades in a compressed band between 5,140 and 5,218 would print a smaller real-body candle (doji or spinning top) on the daily chart. This would be neutral in nature and would simply serve as the setup for the next directional session. Trend traders can largely stand aside; range traders can work the edges of yesterday's candle boundaries.
🔴 Scenario 3: Deeper Corrective Pullback (Probability: ~15%)
Condition: A hawkish Fed speaker, stronger-than-expected US economic data, or a meaningful risk-on shift causes price to break and sustain below 5,137.
Should 5,137 give way convincingly, the next logical corrective targets are the 5,100–5,115 zone, followed by the 5,050–5,080 MA cluster. Even in this scenario, the macro bull trend remains intact while the 5,050 zone holds. This scenario would offer the highest-conviction buying opportunity of the week for medium-term traders, as it aligns a deep Fibonacci retracement with confluent moving average support.
🎯 Daily Trade Signals — 26 February 2026
📗 SIGNAL 1 — BUY (Primary Trend-Following Long)
Directional Bias: Bullish
Basis: Uptrend intact, RSI reset complete, bullish recovery candle confirmed, buyers proven at 5,137, pivot at 5,176 confirmed as near-term anchor.
| Parameter | Level |
|---|---|
| Entry Zone | 5,155 – 5,172 (near close / intraday pivot) |
| TP1 | 5,217 – 5,220 (yesterday's high / R1 pivot) |
| TP2 | 5,245 – 5,250 (recent spike high / structural ceiling) |
| Extended TP3 | 5,290 – 5,320 (model high / extension — only if 5,250 breaks cleanly) |
| Stop Loss | 5,120 – 5,130 (below S1 pivot / intraday structural low) |
| Daily Close Invalidation | Close below 5,100 cancels the setup entirely |
| Risk/Reward (TP1) | ~1 : 2.5 |
| Risk/Reward (TP2) | ~1 : 3.5 |
Entry Notes:
- Do not chase entries above 5,190 without first seeing a pullback and confirmed base.
- Prefer entering on a pullback into 5,155–5,165 with a confirmed bullish 1H candle close.
- Reduce position size by 30–50% ahead of US economic data releases (Consumer Confidence, Durable Goods, any Fed speaker appearances).
📗 SIGNAL 2 — BUY ON DIP (High-Conviction Deep Support Entry)
Basis: If price corrects further before the NY session, the 5,100–5,115 zone offers a higher R/R entry aligned with Fibonacci retracement and tested institutional demand.
| Parameter | Level |
|---|---|
| Entry Zone | 5,100 – 5,115 |
| TP1 | 5,172 – 5,180 (prior close area) |
| TP2 | 5,217 – 5,220 (yesterday's high) |
| Extended TP3 | 5,290 – 5,320 |
| Stop Loss | 5,075 – 5,080 (below deep support / MA cluster) |
| Daily Close Invalidation | Daily close below 5,050 |
| Risk/Reward (TP1) | ~1 : 2 |
| Risk/Reward (TP2) | ~1 : 4 |
Entry Notes:
- This entry only activates if Signal 1 is never triggered and price drops through 5,137.
- Requires a confirmed bullish reversal candle (hammer, bullish engulfing, or morning star) at the entry zone before executing.
- If price reaches this zone without any reversal candle, do not enter — wait for the next signal.
📗 SIGNAL 3 — BUY ON BREAKOUT (Momentum Entry)
Basis: A clean, high-volume daily or 4H close above 5,220 signals a breakout from the current consolidation and activates the next leg of the trend.
| Parameter | Level |
|---|---|
| Entry | Confirmed 1H close above 5,222 |
| TP1 | 5,250 |
| TP2 | 5,290 – 5,320 |
| Stop Loss | 5,190 |
| Risk/Reward (TP1) | ~1 : 2 |
| Risk/Reward (TP2) | ~1 : 4 |
Entry Notes:
- Do not enter on the breakout candle itself — wait for a confirmed close and a successful back-test of 5,217–5,220 as support.
- False breakouts above 5,220 that immediately reverse are common in this ATR environment. Patience is critical.
⚠️ Risk Management Principles for Today
- Maximum risk per trade: 1–2% of total account equity. Given the elevated ATR (~80–150 points daily), this rule is non-negotiable.
- Always verify every level on your own TradingView OANDA chart before placing any order. Broker pricing can vary.
- Reduce position size before major US data releases (approximately 13:30–15:00 GMT today), where price can move 50–80 points in seconds.
- Never move a stop loss further away from entry once a trade is open. In high-volatility environments, this is one of the most common causes of catastrophic account drawdown.
- ATR-based stop placement: Given the ~80–150 point daily range, a minimum stop of 40–50 points from entry is recommended even for intraday setups, otherwise normal volatility will stop out the position before the move has time to develop.
Disclaimer
This article is published strictly for educational and informational purposes by The Investment Trading Hub Academy. It does not constitute financial advice, investment advice, trading advice, or any other form of solicitation or recommendation to buy or sell any financial instrument. The analysis, levels, and trade signal frameworks presented in this article are based entirely on publicly available technical data, widely used analytical tools, and reputable market research sources. They reflect the author's independent technical assessment only and may not be reproduced, redistributed, or used as the basis for investment decisions without independent verification. Trading in foreign exchange, gold, CFDs, and other leveraged products involves a substantial risk of loss and is not suitable for all investors. You may lose part or all of your invested capital. Past technical patterns, indicator readings, and historical price behaviours are not reliable indicators of future results. Always conduct your own due diligence, verify all prices and levels on your own trading platform, and consult a licensed and regulated financial professional before placing any trade or making any investment decision. The Investment Trading Hub Academy and its contributors accept no liability for any trading losses incurred as a result of this publication.