XAU/USD Daily Signal & Deep Technical Analysis — 19 February 2026
📍 Live Price Snapshot
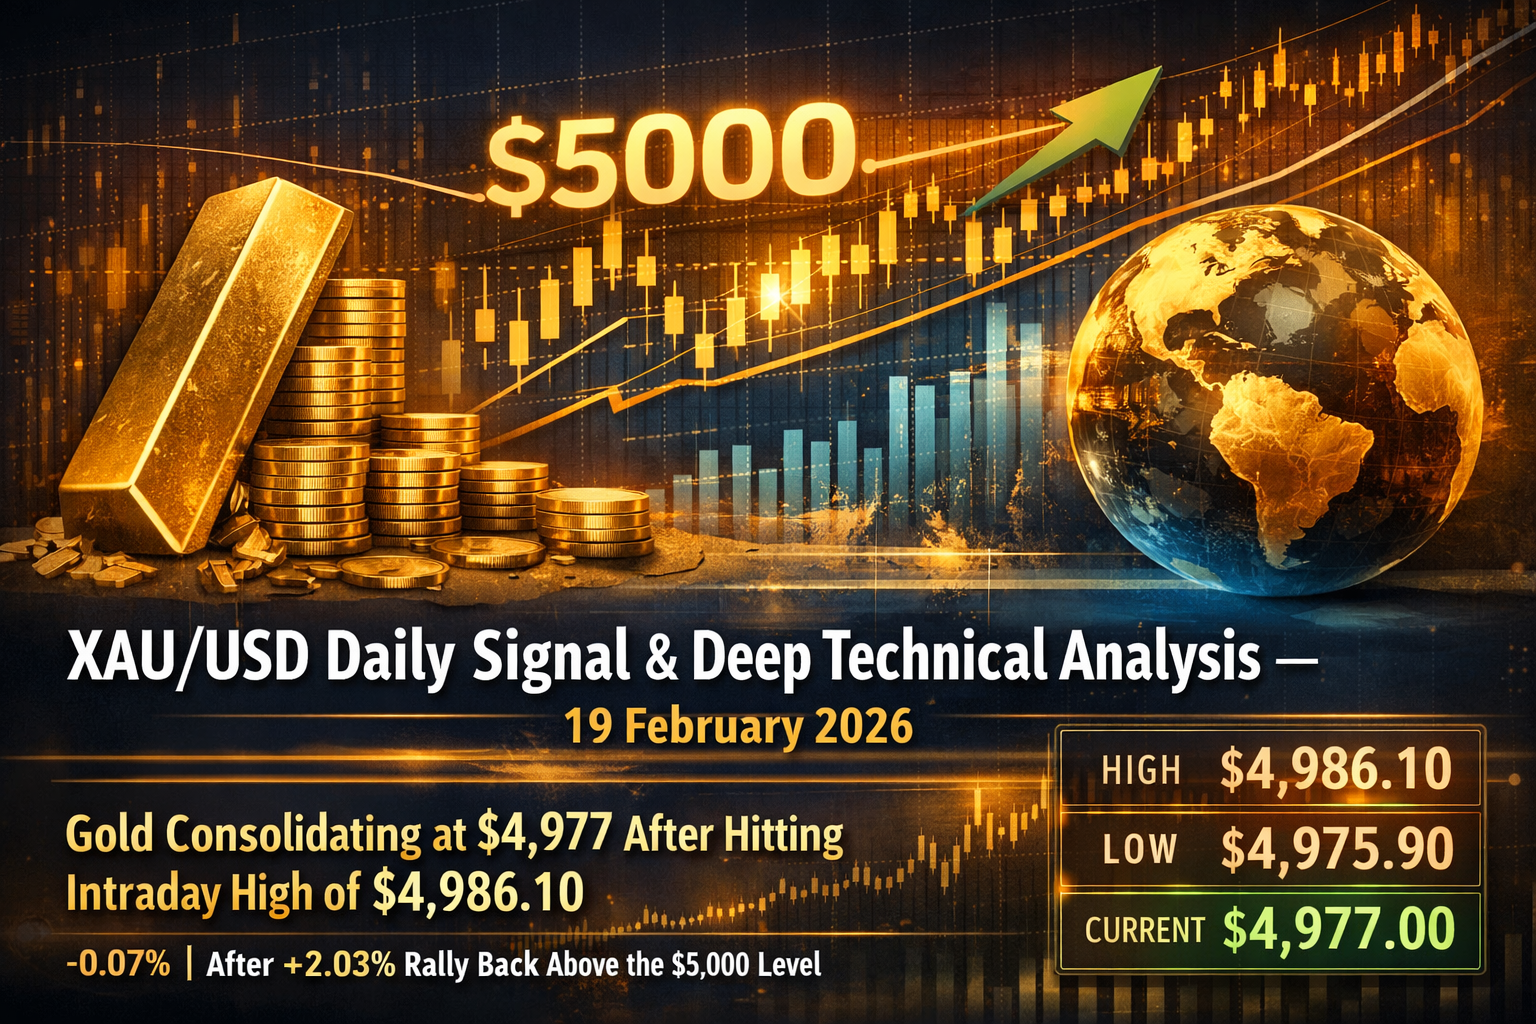
Gold (XAU/USD) opened the February 19, 2026 session at $4,980.60, with an intraday high of $4,986.10, a low of $4,975.90, and is currently consolidating around $4,977 — marginally lower (-0.07%) after a powerful +2.03% rally on February 18 that hauled price back above the critical $5,000 psychological zone. That February 18 surge was driven by surging geopolitical jitters, dovish Fed commentary, and a return of safe-haven demand following the Russia-Ukraine Geneva peace talks and unresolved US-Iran nuclear negotiations.
🏛️ Macro & Fundamental Context
Gold's macro setup in February 2026 remains structurally bullish. Markets are currently pricing approximately 60 basis points of Fed rate cuts for 2026, according to the CME FedWatch Tool. Fed Governor Michael Barr signalled that another rate cut could come "well down the road," while Chicago Fed President Austan Goolsbee suggested "several more" cuts are possible if inflation resumes its decline toward the 2% target. This dovish undercurrent weakens the US Dollar and lifts the non-yielding appeal of gold.
On the geopolitical front, multiple risk factors are sustaining safe-haven demand. US-brokered talks between Russia and Ukraine began in Geneva on February 18 with no ceasefire concluded. Simultaneously, a second round of US-Iran nuclear talks reached a preliminary understanding on "guiding principles," but Iran's Foreign Minister clarified no imminent deal exists — keeping geopolitical risk premiums in the market.
A pivotal data calendar dominates the rest of the week. The FOMC Minutes (released Feb 18 evening) will be dissected for rate-cut timing clues, followed by Friday's triple data bomb of US GDP Q4 2025, core PCE (the Fed's preferred inflation gauge), and housing data — all of which could swing gold volatility sharply. Westpac analysts also note that ongoing de-dollarisation dynamics and central bank accumulation continue to provide a structural price floor beneath gold. The Fear & Greed index sits at 43 (Fear territory), which historically sustains investor appetite for safe-haven assets.
📊 Key Price Levels — 19 February 2026
📈 Technical Analysis — Full Multi-Indicator Breakdown
Trend Structure (Daily & H4)
The long-term daily chart remains firmly bullish. The 21-day SMA is rising above the 50-, 100-, and 200-day SMA readings — a stacked bullish alignment confirming the macro uptrend. However, the current price ($4,977) sits marginally below the 21-day SMA at $4,991.82, which is acting as immediate dynamic resistance and has been tempering upside momentum since the corrective pullback from the $5,597.89 January high.
On the H4 chart, the near-term structure is neutral-to-bearish, as gold consolidates roughly 15% below its January all-time highs. The metal is trapped in a defined range between $4,760 (range low) and $5,096 (range high), with the Feb 13 swing high at $5,046 acting as the critical breakout level. A four-hour candle close above $5,046 would be the signal that the consolidation phase has ended and a fresh bullish leg is underway — potentially targeting a $330 extension toward $5,376.
RSI (14-Period)
The daily RSI prints at 52.29, sitting in neutral territory but edging higher from the lows. This is a stabilising signal — not yet overbought, leaving meaningful room to run on the upside. The 15-minute RSI reads a more extended 75.91 (short-term overbought), suggesting a minor intraday pullback or consolidation is likely before the next directional move. The H4 RSI has recently crossed above the 50-level, which is a confirming bullish crossover supporting the recovery narrative.
MACD (12, 26, 9)
The MACD currently reads 12.88 on the shorter timeframe, with the signal showing a buy configuration. The MACD histogram is expanding to the upside, suggesting increasing bullish momentum on the intraday level. On the daily timeframe, the MACD has formed a nascent bullish crossover following the recovery from the $4,850 weekly low — a constructive signal for the bulls heading into February 19.
Moving Averages (Full Stack)
All major moving averages from MA5 through MA200 continue to slope upward, with gold trading above all of them except the near-term 21-day SMA. This means:
- MA50 ($4,673) — Rising, strong dynamic support
- MA100 ($4,382) — Defines the deeper corrective floor
- MA200 — Well below price, reinforcing the macro bull cycle
The consensus across moving averages remains a Strong Buy on the daily timeframe.
Fibonacci Retracement (Key Reference)
Measured from the January all-time high of $5,597.89 to the recent low of $4,401.99, the critical Fibonacci levels are:
- 38.2% retracement — $4,858 (recently tested and held)
- 50% retracement — $4,999.94 (current cap — critical level)
- 61.8% retracement — $5,141.05 (next major upside target on a daily close above $5,000)
The 50% Fibonacci level at $4,999.94 aligns almost precisely with the $5,000 psychological level, making this zone the single most important battleground for February 19.
Bollinger Bands
On the H4 chart, a Harami reversal candlestick pattern formed near the lower Bollinger Band after the dip to $4,850, which is a classic reversal signal. RoboForex analysts identified this formation and pointed to an upside target of $5,100 as the next wave objective, with an alternative corrective scenario toward $4,840 if the pattern fails.
Stochastic Oscillator
The Stochastic signal lines have rebounded from the ascending support line and formed a bullish crossover, increasing buying pressure on the daily chart. This mirrors the signal that preceded the previous rally leg in late January 2026, adding credence to the recovery scenario.
AROON Indicator (14)
The AROON reads 100.00 on the short-term chart — a maximum bullish reading indicating that the most recent high was just set within the measurement period. This confirms strong short-term buying momentum.
Directional Movement Index (DMI)
The DMI reading of 20.73 suggests a trending environment (readings above 20 confirm a trend). Combined with a bullish AROON and MACD crossover, this supports the bias toward continued upside — though with acknowledgment of the consolidation ceiling at $5,040–$5,046.
🎯 Trading Signal — 19 February 2026
⚠️ This is an educational analysis. Always apply your own risk management.
🟢 PRIMARY SIGNAL: CAUTIOUS BUY (BULLISH BIAS — ~60% Probability)
The daily structure, stacked moving averages, Fibonacci holding, Stochastic bullish crossover, and fear-driven safe-haven demand all tilt the bias toward the upside. The key is whether gold can close a daily candle decisively above the $4,999.94 Fibonacci 50% / $5,000 psychological level.
| Parameter | Level |
|---|---|
| Bias | Buy (Cautious Bullish) |
| Entry Zone | $4,967 – $4,977 (current price / Support 1 dip) |
| Take Profit 1 | $5,040 (R1 / Feb 13 swing high) |
| Take Profit 2 | $5,065 (R2) |
| Take Profit 3 | $5,118 (R3, if FOMC Minutes dovish) |
| Stop Loss | $4,890 (below S2 with buffer) |
| Risk/Reward | ~1:2.5 to 1:3 |
Entry trigger confirmation: Wait for a 1H candle close above $4,985 (reclaiming the 21-day SMA zone) before executing. This filters false breakouts.
🔴 ALTERNATIVE SIGNAL: SELL (BEARISH SCENARIO — ~40% Probability)
If the FOMC Minutes reveal a more hawkish tone than expected and the US Dollar strengthens, gold may fail to reclaim $5,000 and break below Support 1.
| Parameter | Level |
|---|---|
| Bias | Sell (Bearish Scenario) |
| Entry Trigger | H4 close below $4,960 |
| Take Profit 1 | $4,907 (S2) |
| Take Profit 2 | $4,850 (S3 / weekly low) |
| Stop Loss | $5,020 |
| Risk/Reward | ~1:2 |
⚡ Key Catalysts to Watch on February 19
- FOMC Minutes Reaction (released late Feb 18) — Dovish tone → bullish gold; Hawkish lean → bearish
- US Dollar (DXY) — USD strength has been the primary headwind; watch for continuation or reversal
- US-Iran & Russia-Ukraine — Any escalation → gold spikes; Any breakthrough deal → gold sells off
- Friday's PCE + GDP Data — Pre-positioning may begin on February 19
- Chinese Market Liquidity — Chinese markets reopening after Lunar New Year restores normal volume, reducing price distortion vulnerability
- Fear & Greed Index (43 — Fear) — Sustained fear keeps safe-haven bids alive
📋 Signal Summary Dashboard
| Indicator | Reading | Signal |
|---|---|---|
| Daily Trend (SMA Stack) | Bullish alignment | 🟢 BUY |
| RSI (14) Daily | 52.29 — Neutral, rising | 🟡 NEUTRAL |
| RSI (14) 15-Min | 75.91 — Overbought | 🔴 SHORT-TERM CAUTION |
| MACD (12,26,9) | 12.88 — Positive histogram | 🟢 BUY |
| Stochastic | Bullish crossover | 🟢 BUY |
| AROON (14) | 100 — Maximum bullish | 🟢 BUY |
| Bollinger Bands (H4) | Harami near lower band | 🟢 REVERSAL SIGNAL |
| Fibonacci 50% | $4,999.94 — Acting as resistance cap | 🟡 WATCH |
| 21-Day SMA | $4,991.82 — Just above price | 🟡 WATCH |
| Geopolitics | US-Iran, Russia-Ukraine unresolved | 🟢 SAFE HAVEN BID |
| Fed Sentiment | ~60bps cuts priced, dovish lean | 🟢 BUY |
| Fear & Greed | 43 — Fear territory | 🟢 SUPPORTS GOLD |
Overall Daily Signal: 📈 CAUTIOUS BUY — Bias is bullish, but a confirmed reclaim of $5,000–$5,046 is required for high-conviction long entries. Below $4,960, the bearish alternative takes over with $4,850 as the primary downside target.
🔭 Broader Context: Gold's 2026 Structural Bull Cycle
Gold has surged approximately +16% year-to-date in 2026, building on a +60% gain in 2025. Central banks — particularly emerging market institutions — purchased a record 585 tonnes in recent annual cycles, providing a structural price floor. HSBC Asset Management notes that this behaviour is driven by long-term geopolitical incentives rather than cyclical conditions, meaning traditional real-rate regression models are increasingly underpricing gold's risk-return profile. Westpac has revised their gold target to $5,600/oz for 2026, while State Street Global Advisors projected a range of $4,000–$4,500 — already surpassed, reinforcing the bullish structural case. Today's consolidation around $4,977–$5,000 is best interpreted as a healthy pause within a dominant bull cycle, not a trend reversal.