

XAU/USD Daily Signal & Deep Market Analysis — March 17, 2026
⚡ Live Price Check
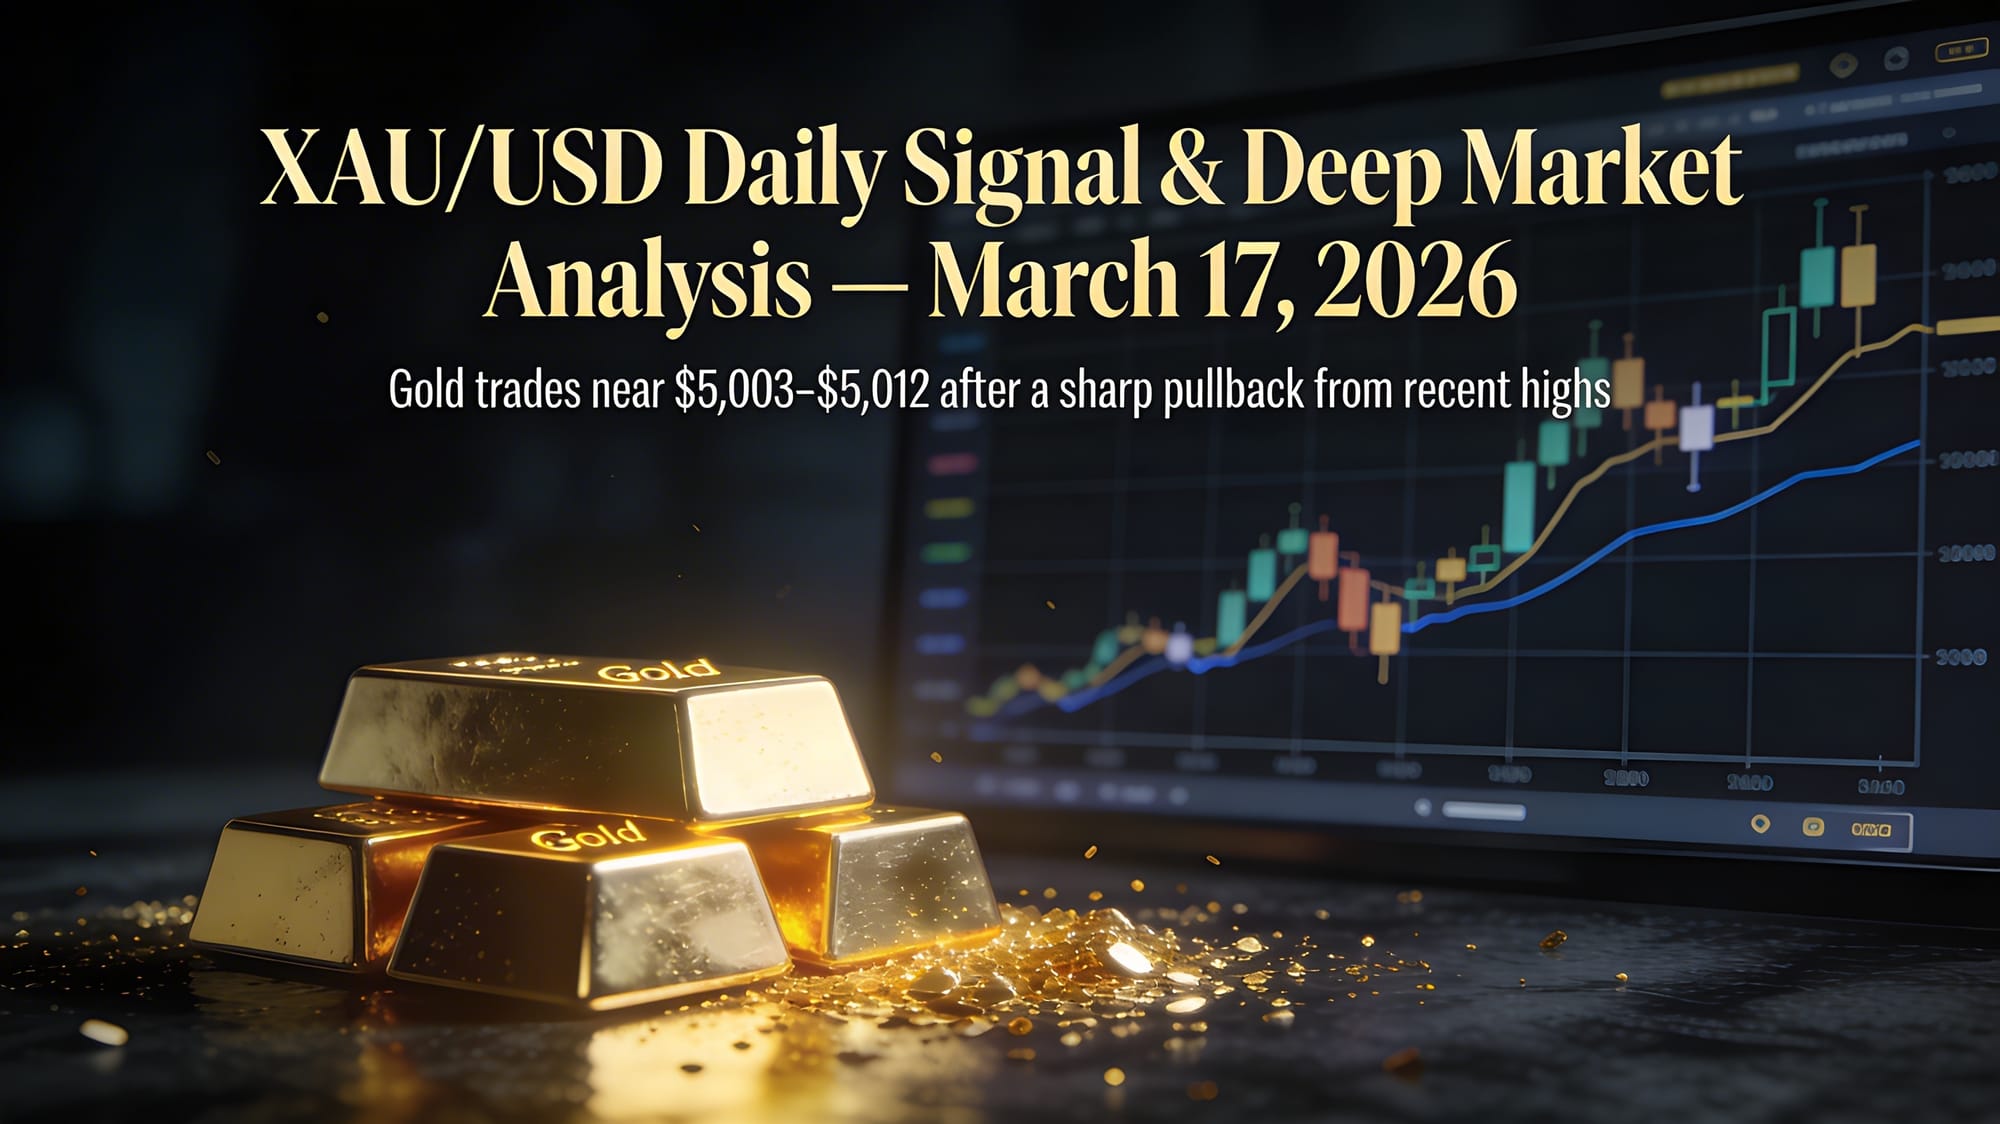
As of the early hours of March 17, 2026, XAU/USD is trading at approximately $5,003–$5,012 per troy ounce, with the session opening at $5,012.50, printing a high of $5,022.50 and a low of $5,005.10. FXEmpire confirms the price near $5,003.31 as of 00:33 UTC. Gold has declined significantly from its recent peak near $5,246 earlier in the month, representing a correction of approximately 4.6% in under two weeks. The all-time high of $5,608.35 was reached in January 2026.
🧭 Today's Primary Signal
SIGNAL: NEUTRAL-TO-BEARISH | PRIMARY BIAS = SELL ON BOUNCE
Pre-FOMC Consolidation Zone — Critical Inflection at $5,000
| Parameter | Primary (Bear) Scenario | Alternative (Bull) Scenario |
|---|---|---|
| Bias | Sell / Short | Buy / Long |
| Entry Zone | $5,010 – $5,025 (bounce rejection) | Break & close above $5,065 |
| Take Profit 1 | $4,996 | $5,108 |
| Take Profit 2 | $4,938 | $5,154 |
| Take Profit 3 | $4,882 | $5,208 |
| Stop Loss | $5,055 | $5,025 |
| Risk/Reward | ~1:2.1 | ~1:2.4 |
| Confidence | ⭐⭐⭐⭐ (Moderate-High) | ⭐⭐⭐ (Conditional) |
⚠️ FOMC Warning: The Federal Reserve's two-day meeting begins today, March 17, with the rate decision released on March 18. Expect compressed volatility during the Asian and early European sessions, with a potential breakout in either direction post-decision tomorrow.
📊 Technical Analysis — Daily Chart
The daily structure for XAU/USD has deteriorated markedly over the past five sessions. Gold broke from a high of ~$5,246 on March 9 and has cascaded through multiple support levels, settling near the critical $5,000 psychological zone. According to TradingEconomics, gold fell to $5,011.71 on March 16, down 0.21% from the prior day, while the monthly gain still holds at +2.71%.
Moving Averages
The price action relative to the moving average stack tells a clear bearish short-term story:
- 20-Day SMA: ~$5,048 — Price is currently BELOW this level, a bearish signal
- 50-Day SMA: ~$4,814 — Acting as the next major dynamic support
- 100-Day SMA: ~$4,477 — Deep structural support defining the broader uptrend
- 200-Day SMA: ~$3,969 — Long-term bull trend fully intact
Both VWAP and the SMA20 are trading above current market price, which confirms near-term bearish momentum. However, the medium and long-term MAs remain deeply supportive, meaning this is a correction within a bull market, not a structural reversal.
Oscillators & Momentum Indicators
The oscillator picture is mixed, but tilted bearish for the immediate session:
The Investing.com aggregate of technical indicators reads Strong Sell with 6 sell signals vs. 2 buy signals. Crucially, however, the MACD is rising in negative territory — a classic early sign that selling momentum is losing steam, which aligns with a potential near-term bounce before the downtrend resumes.
Candlestick Patterns
Two key candlestick signals are competing at the $5,000 area:
- Spinning Top near the $4,996.26 support level on the 4H chart — this indecision candle signals temporary consolidation and uncertainty at a pivotal zone.
- Hammer Reversal Pattern near the lower Bollinger Band on the H4 — this is a classic bullish reversal signal suggesting that sellers may be exhausted near current lows.
These contradicting signals are exactly why today's primary call is neutral-to-bearish, but not aggressively short. The $5,000 zone is a battleground, not a one-way street.
Bollinger Bands
Price has pressed down to the lower Bollinger Band on the H4 timeframe, which historically provides at least a temporary bounce. This supports the possibility of a short-term relief rally to the $5,050–$5,080 zone before bearish pressure resumes.
🗝️ Key Support & Resistance Levels
Resistance Zones (Sell Areas / Bull Targets)
Support Zones (Buy Areas / Bear Targets)
🌍 Fundamental Drivers for March 17, 2026
1. FOMC Pre-Meeting Paralysis (MOST CRITICAL)
The Federal Reserve's two-day FOMC meeting opens today, with the rate decision on March 18. According to CME Group data, a staggering 99.2% of market participants expect rates to remain unchanged at 3.50–3.75%, with only 0.8% pricing in a cut to 3.25–3.50%. Holding rates steady reduces gold's appeal as a non-yielding asset in the short term, and any hawkish surprise in the statement or dot plot could push gold further toward $4,880–$4,840.
The market had previously priced in multiple rate cuts for 2026. Those expectations have been dramatically scaled back to just one cut, likely in the second half of 2026, due to persistent inflation above the 2% target. This repricing is one of the central reasons gold has corrected from $5,600+ highs.
2. U.S. Dollar Index (DXY) — Key Headwind
The DXY sits at approximately 99.45, a critical inflection point. A break above 100 would be a meaningful headwind for gold, as the dollar-denominated metal becomes more expensive for foreign buyers. Conversely, a reversal below 99 would be supportive and could fuel a bounce. Dollar strength has been the single biggest suppressant of gold's safe-haven premium this week, even as Middle East tensions escalate.
3. Middle East Geopolitics — Two-Sided Risk
The US-Iranian conflict and associated military activity remain a key background driver. Ironically, the geopolitical risk has not reliably boosted gold recently, because elevated oil prices (Brent crude above $80/barrel) feed inflation fears that push the Fed toward hawkishness, thereby strengthening the dollar and capping gold. However, any sudden escalation — new strikes, expanded conflict — could reverse this dynamic rapidly. The geopolitical risk premium provides a floor, not a ceiling.
4. US Industrial Production Data
The fundamental backdrop for March 16–17 includes US industrial production data, which is projected to slow sharply to 0.1% from 0.7% prior. A weaker industrial output reading pressures the USD and could provide gold a short-term tailwind, but the effect is likely muted ahead of the FOMC decision.
5. Tariff Policy & Inflation Fears
The US administration's 10% universal tariffs (Section 122), with potential escalation to 15%, are creating a structural inflation premium in gold pricing. Core producer prices rose 0.8% in January — the strongest monthly increase since mid-2025 — reinforcing stagflation concerns that make gold a critical portfolio hedge. This underpins the long-term bull case but is already partially priced in at current levels.
6. CFTC Positioning — Speculative Long Interest
CFTC data shows Gold speculative net positions at 237,100 contracts (previous report). This remains historically elevated, meaning the market is not yet under-positioned in gold longs. In a risk-off or FOMC hawkish scenario, this positioning overhang could accelerate a sell-off as leveraged longs liquidate.
📈 Elliott Wave & Broader Structure
Within the broader Elliott Wave context, XAU/USD has been completing what appears to be a corrective wave (ABC structure) from the January 2026 all-time high near $5,608. The current leg has retraced to the $5,000–$5,020 area, which aligns with the 0.382–0.5 Fibonacci retracement of the prior impulsive move. RoboForex analysis confirms: "gold is finishing its corrective wave" with quotes testing the $5,020 level. The ascending channel structure from 2024 remains intact as long as gold holds above $4,814 (50-day SMA).
A confirmed close above $5,200 on the daily chart would signal the resumption of the primary impulsive wave toward $5,370–$5,600. Conversely, a decisive daily close below $4,996 would open the door to $4,840 and potentially $4,760.
🏦 Institutional Price Targets for 2026
These targets confirm the long-term bull case remains structurally intact. The current weakness is a correction opportunity within a mega bull trend, not a reversal.
🎯 Trading Scenarios Summary for March 17, 2026
Scenario A — Bear Case (Primary, ~60% probability):
Gold struggles to reclaim $5,030+ in the pre-FOMC environment. Price continues to consolidate near $5,000–$5,010 with downside pressure toward $4,996 and then $4,938. Sell any intraday bounces toward $5,020–$5,025. The FOMC's "no cut" decision tomorrow may be accompanied by hawkish dot plot revisions, extending the sell-off.
Scenario B — Bull Case (Alternative, ~40% probability):
The Hammer pattern on the H4 chart triggers short-covering. Price reclaims $5,065 on volume, confirming the corrective wave is complete. A rally toward $5,107–$5,154 unfolds as bulls position ahead of the Fed, hoping for a dovish surprise or soft dot-plot revision.
Scenario C — Range/Flat (~Overlapping):
Gold trades in a tight $4,980–$5,050 band for most of the session as markets await Wednesday's FOMC statement. This is historically the most common pre-Fed behavior and is consistent with the Spinning Top candlestick pattern currently forming at support.
⚖️ Risk Management Notice
Gold is currently in a high-volatility regime with the FOMC decision less than 24 hours away. Position sizing should be reduced by 30–50% versus normal to account for potential whipsaws. Do not hold unhedged directional positions through the FOMC statement release on March 18. The $5,000 level is a critical binary trigger — respect it with tight stops. All analysis is for educational purposes only. Past performance is not indicative of future results.
Data sources for this analysis include real-time price data from TwelveData, FXEmpire, and TradingEconomics; technical analysis from LiteFinance, RoboForex, MarketPulse, and Capital.com; fundamental data from Investing.com, PhemEx, Canadian Mining Report, and Goldman Sachs. All prices are in USD per troy ounce.