
XAU/USD Daily Signal & Deep Market Analysis — February 18, 2026
📍 Live Price Snapshot (As of Feb 17, 2026)
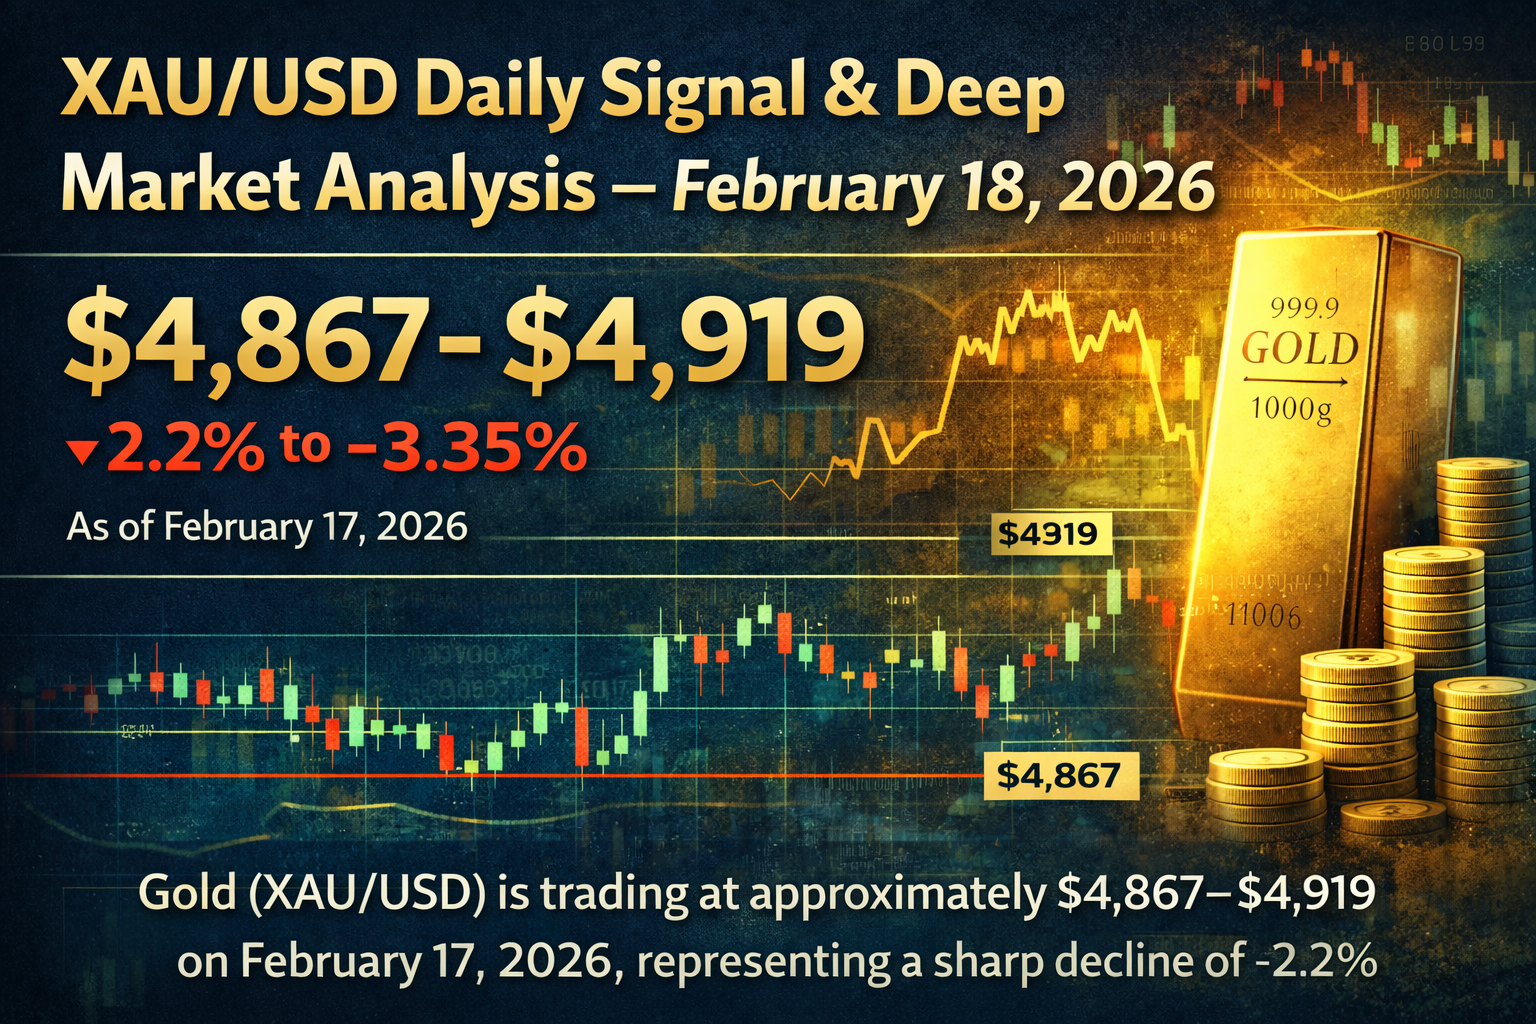
Gold (XAU/USD) is trading at approximately $4,867–$4,919 on February 17, 2026, representing a sharp decline of -2.2% to -3.35% on the day. The pair opened the session at $4,955 and printed an intraday low of $4,841, having failed to hold the psychologically critical $5,000 handle. This follows a notable drop from the recent $5,100+ peak hit just days earlier, as the market has entered a pronounced corrective phase from the all-time high territory above $5,500 recorded in late January 2026.
📊 The Trading Signal for February 18, 2026
⚠️ IMPORTANT DISCLAIMER: This analysis is purely educational and informational. All trading involves substantial risk of loss. Past patterns do not guarantee future results. Always apply your own risk management.
Primary Signal: CAUTIOUS SELL / BEARISH BIAS with a Key Level Bounce Watch
| Parameter | Level |
|---|---|
| Bias | Bearish (Short-Term) |
| Current Price (Feb 17 close) | ~$4,867–$4,881 |
| Primary Sell Entry Zone | $4,940 – $4,980 (on any bounce) |
| Alternative Buy Entry (Bounce) | $4,808 – $4,850 (demand zone) |
| Key Resistance Levels | $4,980 / $5,040 / $5,100 |
| Key Support Levels | $4,850 / $4,808 / $4,740 |
| Short Target 1 | $4,850 |
| Short Target 2 | $4,808 |
| Short Target 3 (Extended) | $4,740 |
| Sell Stop-Loss | $5,045 (daily close above) |
| Long Bounce Stop-Loss | $4,790 (daily close below) |
| Risk/Reward (Short) | ~1:2.0 |
🔍 Technical Analysis — Daily Chart
Price Structure & Trend
Gold remains in a macro bull market but is currently experiencing a significant short-term corrective phase. The pair peaked at approximately $5,595 on January 29, 2026, before a violent reversal — described by analysts as a "Black Friday" event — sent prices plummeting to a low of around $4,400 on February 2. A recovery brought price back above $5,100 before another wave of selling this week pulled the pair back below $5,000. Price is now trading below the critical $4,950 support, which has been broken and is now acting as immediate resistance.
Fibonacci Retracement Analysis
Using the January 2026 swing high (~$5,595) and the February 2 low (~$4,406) as the key swing levels, the critical Fibonacci retracement levels are:
- 23.6% Retracement: ~$5,315 (already reclaimed and failed)
- 38.2% Retracement: ~$5,050 (broken to the downside, now resistance)
- 50% Retracement: ~$5,000 (psychological — now a key battleground)
- 61.8% Retracement (Golden Ratio): ~$4,800–$4,808 (major structural support)
- 78.6% Retracement: ~$4,600 (deep support if $4,800 fails)
The 61.8% Fibonacci level near $4,808 is the most critical support zone for February 18. A hold here could trigger a meaningful bounce, while a break risks a deeper flush toward $4,600–$4,740.
Moving Averages
- 21-day SMA: Acting as dynamic resistance around $4,980–$5,000; the break below this level is a bearish signal
- 50-day EMA: Located near $4,600–$4,700, providing longer-term structural support
- 200-day SMA: Well below current price (~$4,300–$4,325 area), confirming the macro bull trend remains intact
- The overall moving average picture on the short-term (daily) frame is bearish, with price trading below its 20 and 50-period MAs on the daily chart, indicating seller control in the near-term
RSI (Relative Strength Index — 14-period)
The RSI on the daily chart is currently reading approximately 46–47, a neutral-to-bearish reading below the 50 midline. This confirms the current corrective momentum but importantly shows the market is not yet in oversold territory (below 30), suggesting further downside potential before a meaningful reversal. There is no confirmed bearish divergence that would suggest an imminent bottom at current levels.
MACD (12, 26, 9)
The MACD indicator is showing a bearish crossover developing on the daily chart as the fast EMA closes in on the signal line from below. The histogram bars, while having shown buy signals on shorter timeframes in mid-February, are now contracting, pointing toward a loss of bullish momentum. A clear MACD histogram cross into negative territory would confirm acceleration of the corrective move.
Stochastic Oscillator & Other Oscillators
- Stochastic (9,6): Reading ~37, in sell territory and pointing downward — confirming short-term bearish pressure
- Williams %R: Reading approximately -69 to -70, approaching oversold territory but not yet at extreme levels
- CCI (14): At approximately -111, in bearish territory, suggesting ongoing selling pressure
- ADX (14): ~37, indicating the trend is strong, not just a minor fluctuation
Bollinger Bands & Volatility
Gold has displayed exceptional volatility throughout February 2026 — ATR (Average True Range) has been running extremely wide, with daily ranges exceeding $200–$400. Price has broken below the middle Bollinger Band, signaling potential continuation toward the lower band. The lower band near $4,800–$4,850 aligns with the Fibonacci 61.8% zone, making this a high-probability confluence support area.
Chart Patterns
A Rising Wedge pattern has been identified on the daily chart, which is a classically bearish formation. The breakdown from the $5,100 area through the lower trendline of this wedge activates a measured move target pointing toward the $4,800–$4,820 zone. Additionally, the pair has broken below a key ascending trendline that has been in place since September 2025, which adds to the bearish short-term picture.
🌍 Fundamental & Macro Drivers
Fed Meeting Minutes — Key Event February 18
The most important catalyst for February 18 is the release of the January FOMC meeting minutes, scheduled for Wednesday February 18. This document will provide critical clues on the Fed's posture. Markets are currently pricing in the first rate cut as early as June 2026according to the CME FedWatch Tool. If the minutes reveal a more hawkish-than-expected tone, the USD could strengthen further and press gold lower toward the $4,808 target. Conversely, dovish language could spark a sharp relief rally back to $5,000+.
US Dollar (DXY) Strength
The US Dollar Index (DXY) rose 0.2% on February 17, adding immediate downward pressure to gold. A USD trading above the 101.5 area is considered a negative catalyst for gold, while a breakdown below 101.5 would be bullish for XAU/USD. Traders must monitor DXY closely on February 18 alongside the FOMC minutes.
Geopolitical "Fear Premium" Fading
One of the key drivers of gold's explosive rally to $5,600 in January was a geopolitical risk premium tied to global tensions. Negotiations in Geneva and Oman have shown signs of progress, causing this premium to fade materially. As the "fear premium" unwinds, gold loses a structural pillar of support and is vulnerable to further corrective pressure.
Lunar New Year — Thin Asian Liquidity
Asian markets, particularly China, remain closed for the Lunar New Year holiday, which runs until approximately February 23, 2026. This absence removes a massive source of physical gold demand — China is the world's largest gold consumer. Thin liquidity conditions mean smaller market participants can move prices more aggressively in either direction, amplifying volatility and increasing the risk of false breakouts. The return of Chinese buyers post-holiday is expected to be a structural bullish catalyst for the following week.
Central Bank Demand & UBS 2026 Target
Despite the short-term correction, the longer-term fundamental backdrop remains firmly bullish. UBS has set a 2026 gold price target of $6,200, citing continued central bank accumulation and structural dollar weakness. Central bank demand has been running at over 1,000 tonnes annually, providing a solid "buy-the-dip" institutional floor. The current correction is being characterised as a "volatility shakeout" rather than a trend reversal by major banks.
Inflation & Fed Easing Expectations
Weaker-than-expected US inflation data has reinforced market expectations of Fed easing in 2026. Lower real interest rates are structurally bullish for non-yielding gold. However, the timing uncertainty around rate cuts means gold faces near-term headwinds as the market awaits clearer Fed guidance — which makes the February 18 FOMC minutes all the more pivotal.
📅 Key Levels Consolidated for February 18, 2026
⚡ Likely Scenarios for February 18
Scenario A — Bearish Continuation (60% probability): Gold opens below $4,900 and fails to reclaim $4,950 resistance. The FOMC minutes on Feb 18 show a relatively neutral-to-hawkish tone, supporting the dollar. Thin liquidity with Asian markets still closed accelerates the move toward the $4,850 and $4,808 support zone. This is the base case given the current momentum, broken trendlines, and technical setup.
Scenario B — Bounce from Support (30% probability): Price tags the $4,808–$4,850 confluence zone (61.8% Fibonacci + Bollinger lower band), triggering a sharp short-covering bounce back to $4,950–$5,000. The FOMC minutes reveal dovish language around rate cuts, weakening the dollar and giving gold a relief rally. This scenario is supported by the RSI nearing neutral and the strong institutional "buy-the-dip" presence.
Scenario C — Breakout Above $5,000 (10% probability): An unexpected positive catalyst (e.g., escalating geopolitical shock, extremely dovish FOMC minutes, or surprise Fed communication) drives a gap above $4,980–$5,000, targeting $5,040–$5,100. This is the low-probability upside surprise scenario.
🔑 Trading Plan Summary
For Short (Sell) Traders:
- Look for a dead cat bounce to the $4,940–$4,980 zone, then enter short
- Target $4,850 → $4,808
- Stop-loss on a daily close above $5,045
For Long (Buy) Traders — Counter-Trend:
- Wait for price to reach $4,808–$4,850 confluence zone
- Look for a bullish rejection candle (hammer, engulfing) before entering
- Target recovery to $4,950–$5,000
- Stop-loss on a daily close below $4,790
Key Watch on February 18: The FOMC meeting minutes release is the single most important event and can override all technical signals. Trade carefully around that release — widen stops or stand aside if uncertain.
The macro bull trend for gold remains structurally intact, with UBS targeting $6,200 by year-end 2026 and central banks continuing to accumulate. However, in the short-term daily context, the broken trendlines, failed $5,000 support, Rising Wedge breakdown, bearish moving average alignment, and thin Lunar New Year liquidity all point to further corrective pressure on February 18, with the $4,808–$4,850 zone as the key battleground to watch for either a decisive breakdown or an institutional bounce reversal.