
XAU/USD Daily Analysis & Trading Signal — Monday, 9 March 2026
Live Price Snapshot (March 8, 2026)
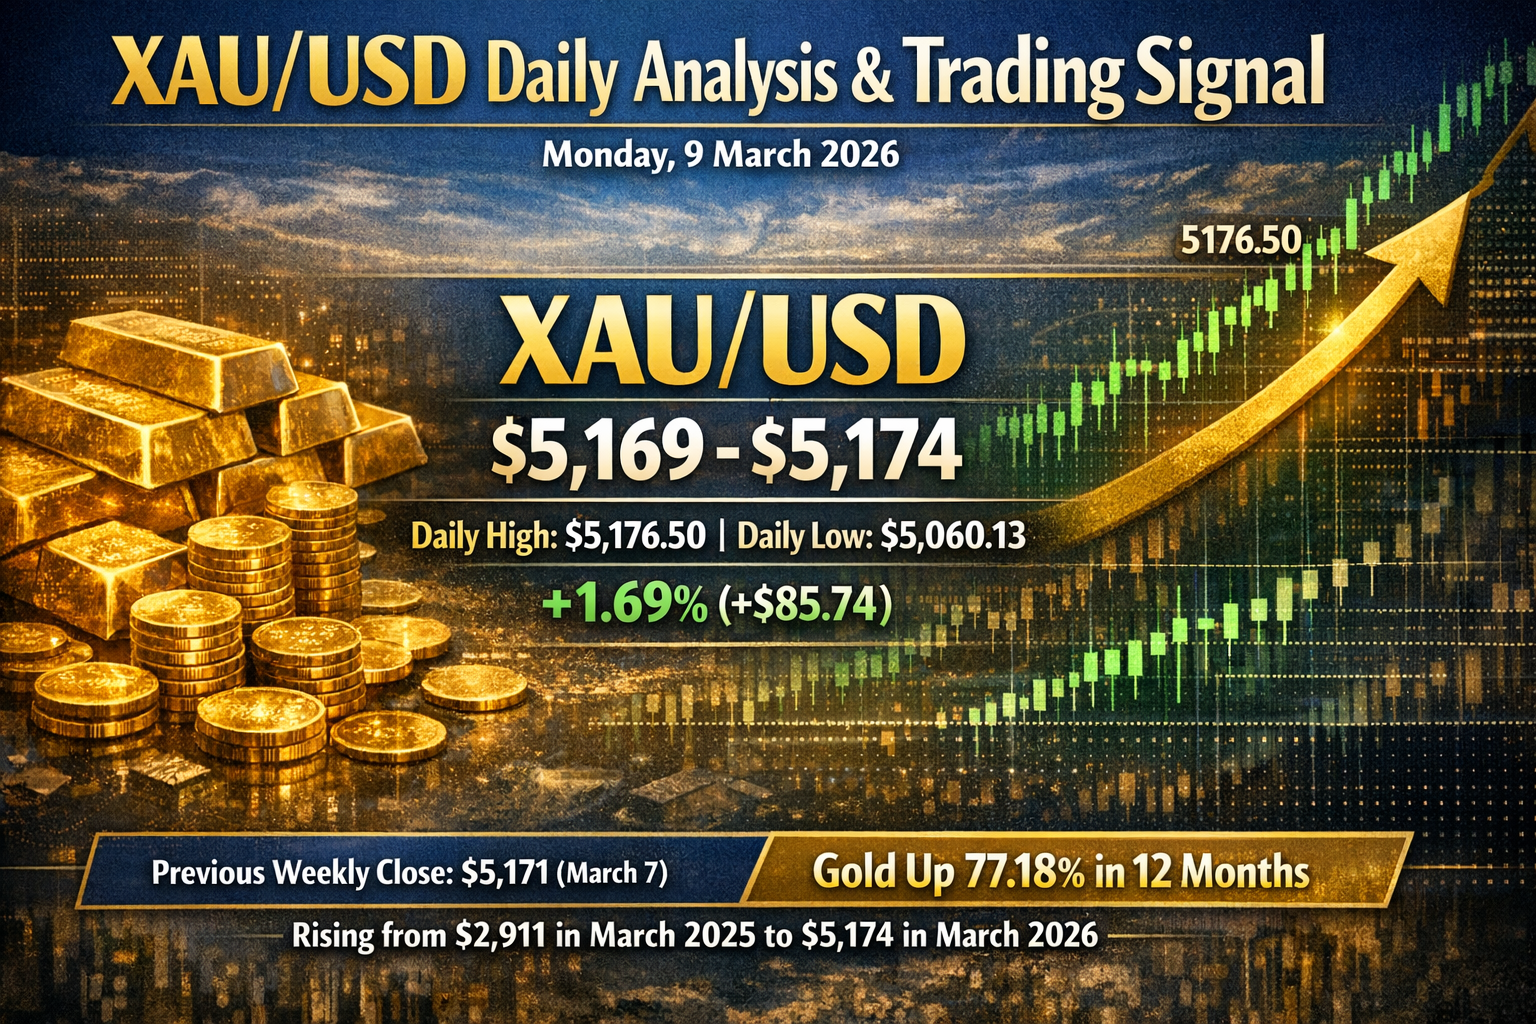
XAU/USD is currently trading at approximately $5,169–$5,174 per ounce as markets close into the weekend. The session posted a strong bullish close, with spot gold printing a daily high of $5,176.50 and a daily low of $5,060.13, representing a daily gain of +1.69% (+$85.74). The previous weekly close on March 7 was recorded near $5,171. Gold has gained an extraordinary 77.18% over the past 12 months, rising from approximately $2,911 in March 2025 to its current levels.
Market Context: Where Gold Stands
Gold has been one of the most dominant assets in 2026. After printing an all-time high of $5,595.46 on January 29, 2026, the metal staged a violent two-way correction in late February and early March — collapsing from $5,419 to briefly below $5,000 on March 3-4 before recovering sharply. As of the March 8 close, XAU/USD is consolidating in a corrective recovery phase, sitting roughly 7.5% below its all-time high and in the middle of its identified weekly trading band.
The key structural story is that gold remains inside a large ascending bullish channel, trading above all major long-term moving averages. The 100-day SMA is positioned around $4,477, providing a deep but powerful foundation for the broader uptrend. Moving averages across multiple timeframes continue to confirm the dominant uptrend.
Fundamental Drivers Heading Into March 9
Multiple fundamental forces will shape Monday's session. Understanding each is critical for positioning.
Geopolitical Risk Premium
The most significant fundamental driver underpinning gold is the escalating Middle East conflict involving US and Israeli military strikes on Iranian territory. Anti-American forces have responded with attacks on US military facilities, with analysts now openly reassessing "all-out war" scenarios. This geopolitical risk premium is deeply embedded in the current gold price and is not expected to dissipate over a weekend — in fact, weekend developments can trigger gap openings when futures reopen Sunday evening (New York time).
Investors are actively rotating out of Gulf equities and regional currencies, with rising marine insurance premiums signalling capital flow stress in the region. Institutional portfolio managers are rebalancing toward safer havens, and gold is the primary beneficiary.
Federal Reserve Policy & Rate Expectations
The Federal Reserve's rate posture remains a dual-edged factor. As of the latest CME Group data, 95.6% of market participants expect rates to remain unchanged at 3.50–3.75% in March. However, the probability of a June rate cut stands at 68%, which is anchoring dovish expectations and limiting the US dollar's ceiling.
Real yields — the most dominant fundamental driver of gold — have declined from 2.36% to 2.08%, removing $120–$150 of opportunity cost from holding the metal. This yield compression is structurally bullish for gold and provides a macro floor for any intraday dips.
US Tariff Environment
The US administration's use of Section 122 to impose universal 10% tariffs has been a significant support for gold as a hedge against systemic and inflation risks. The US Trade Representative indicated tariffs could rise to 15% following a new Supreme Court ruling, which would add another inflationary layer supporting bullion. Core producer prices already rose 0.8% in January — the strongest monthly increase since mid-2025.
Key Economic Events This Week (Risk Calendar)
The week of March 9–13 is data-heavy, and Monday's price action may be more subdued as markets position ahead of these releases:
| Date | Event | Potential Gold Impact |
|---|---|---|
| March 11 | US CPI (February) | High — hot print = dollar up, gold down; cool print = gold up |
| March 12 | Initial Jobless Claims | Moderate — labour weakness supports dovish Fed = bullish gold |
| March 13 | US GDP Q4 Final + Michigan 5Y Inflation Expectations + JOLTS | High — weak GDP = flight to safety = bullish |
| March 18 | Federal Reserve Interest Rate Decision | Extreme — most critical event of the month |
Monday, March 9 will likely be a positioning session where traders await the CPI print on Tuesday, March 11. Expect tighter-than-average ranges with a cautious tone early in the session.
Technical Analysis: Daily & 4H Chart Breakdown
Price Structure & Trend
Gold's macro trend is unambiguously bullish — the price remains above all key long-period moving averages and inside an ascending channel. However, the short-to-medium-term structure is corrective: prices pulled back approximately 7% from the January ATH and are now attempting to base and recoil.
On the daily chart, gold is sitting below the 9-day SMA near $5,200, which has become the first significant dynamic resistance. A daily close above this level would signal a resumption of the bullish trend and invite institutional buyers.
On the 4-hour chart, the most recent action shows price consolidating in the $5,052–$5,208 range, with a notable candlestick development: a Morning Star reversal pattern forming between $5,052.87 and $5,107.72, which is a classic three-candle bullish reversal signal indicating increasing demand from the support zone.
Moving Averages
| MA | Status | Signal |
|---|---|---|
| 9-day SMA | ~$5,200 (above price) | Resistance |
| 20-day SMA | Above market price | Bearish pressure short-term |
| VWAP | Above market price | Selling pressure |
| 100-day SMA | ~$4,477 | Deep support / macro floor |
| Long-term channel support | ~$4,805 (weekly correction target) | Structural floor |
The fact that the 20-day SMA and VWAP both sit above the current price is the bearish argument in the short-term — it means any rally needs to overcome these overhead supply zones before the bulls fully regain control.
RSI (Relative Strength Index)
The RSI on the 4H chart is reading approximately 44, rising, and — crucially — has formed a bullish divergence. This means that while the price made a lower low during the correction, the RSI made a higher low, indicating that downside momentum is weakening and a reversal is building. This is one of the strongest reversal signals in technical analysis.
On the daily chart, the RSI had previously been at 75.4 (overbought) near the highs and has since cooled substantially. The RSI ascending trendline retest — on the weekly chart — has historically preceded sharp upward moves each time it has been tested and held.
On a secondary oscillator level:
- StochRSI: 8.917 — Oversold
- Williams %R: -86.393 — Oversold
- Stochastic (9,6): 36.784 — Sell / Cooling
- CCI (14): -107.7196 — Sell
The oversold readings on StochRSI and Williams %R are particularly notable — these typically precede sharp short-covering and mean-reversion bounces, especially when coinciding with a bullish divergence on RSI.
MACD
The MACD on the 4H chart is rising in positive territory and approaching the zero line. This configuration — rising MACD approaching the centreline from below — is a classic momentum recovery signal that often precedes a breakout to the upside. The hourly MACD has also formed a "higher low" (bullish divergence) below its centreline, confirming that bearish momentum has meaningfully eased.
ADX (Average Directional Index)
The ADX is reading 20.072 — classified as Neutral. This means that the current market is not in a strongly trending phase in the short term. A reading below 25 indicates a ranging/consolidating market, which aligns with the expected Monday consolidation pattern ahead of CPI. A push of ADX above 25 would confirm a new directional trend is beginning.
Fibonacci & Key Price Levels
The $5,046–$5,052 zone is a critical confluence support area where:
- The 20-day moving average intersects
- The minor ascending channel support sits
- The 61.8% Fibonacci retracement of the February rally lies
This makes the $5,046–$5,107 band the highest-probability support zone for any Monday dip.
Support & Resistance Map for March 9
| Level | Type | Significance |
|---|---|---|
| $5,266.41 | Resistance | Key daily resistance, weekly upper target |
| $5,208.41 | Resistance | Immediate overhead resistance |
| $5,153.72 | Resistance | Near-term supply zone |
| $5,171 | Current Price | Weekend close level |
| $5,107.72 | Support | Key support — break triggers bearish move |
| $5,052.87 | Support | Strong support / Fib 61.8% |
| $4,996.26 | Support | Key daily low target |
| $4,805 | Support | Weekly correction target (deeper pullback) |
| $5,000 | Support | Psychological round number |
Market Sentiment & Positioning
Market sentiment heading into March 9 is cautiously bullish with short-term uncertainty. The gold market has corrected approximately $425 from the ATH, shaking out weak longs and resetting positioning. The Shooting Star reversal pattern that formed near the upper Bollinger Band at the highs signalled that a healthy correction was needed — and that correction appears to be in its later stages based on oversold oscillator readings.
Institutional positioning data shows that trading volume in gold contracts has been elevated during the corrective phase, consistent with institutional accumulation at lower prices rather than distribution. The return of safe-haven demand on March 8 (+1.69%) suggests buyers are re-entering at current levels.
The DXY (US Dollar Index) remains a key variable. A breakdown below the 103.0 level would remove a significant headwind for gold and could accelerate a move through $5,200 and toward $5,267–$5,315. Conversely, a strong dollar bounce on any risk-off event unrelated to Middle East conflict could pressure gold back toward the $5,052 support zone.
⚡ XAU/USD Trading Signal — Monday, March 9, 2026
⚠️ Disclaimer: This is an educational analysis. All trading involves risk. Past performance does not guarantee future results. Always use proper risk management.
📊 Overall Bias: CAUTIOUS BULLISH | Probability Rating: 62% Bull / 38% Bear
Gold is entering Monday in a recovery posture after Friday's strong +1.69% session. The confluence of oversold oscillators (StochRSI 8.9, Williams %R -86), bullish RSI divergence, Morning Star formation, and recovering MACD — combined with the persistent geopolitical risk premium — creates a lean-bullish setup for March 9. However, the proximity of the 9-day SMA resistance near $5,200 and the pre-CPI positioning caution means the upside may be limited to the $5,208–$5,266 zone during Monday's session specifically.
🟢 PRIMARY SIGNAL — BUY (Bullish)
Scenario: Price dips early in the session to retest support, then rebounds
| Parameter | Level |
|---|---|
| Entry Zone | $5,100 – $5,130 (dip to support zone) |
| Alternative Entry | Break & hold above $5,208 on volume |
| Take Profit 1 (TP1) | $5,208.41 |
| Take Profit 2 (TP2) | $5,266.41 |
| Take Profit 3 (TP3) | $5,320.89 |
| Stop Loss | $5,052.87 (below key support & Fib 61.8%) |
| Risk/Reward Ratio | ~1:2.5 (TP1) / ~1:4.2 (TP2) |
Trigger Conditions: Monday opens at or near $5,150–$5,175 (gap continuation from Friday), and price holds above the $5,107 support on the first hourly candle close. Confirmation via MACD maintaining its bullish cross on the 4H chart.
🔴 ALTERNATIVE SIGNAL — SELL (Bearish)
Scenario: Price fails to hold $5,107 and breaks lower on volume
| Parameter | Level |
|---|---|
| Entry | Break & close below $5,107.72 on 4H candle |
| Take Profit 1 (TP1) | $5,052.87 |
| Take Profit 2 (TP2) | $4,996.26 |
| Stop Loss | $5,153.72 |
| Risk/Reward Ratio | ~1:1.6 (TP1) / ~1:3.0 (TP2) |
Trigger Conditions: A clean break below $5,107 accompanied by rising bearish volume on the 1H chart, with MACD crossing back below zero. Watch for DXY spiking above 104 as a confirmation.
Weekly Outlook (March 9–13)
The week of March 9–13 carries a wide expected price range of $4,881.57 to $5,426.67. The dominant narrative will shift to Tuesday's US CPI print for February. A cooler-than-expected CPI would fuel a dollar selloff and push gold aggressively through $5,208 toward $5,266–$5,320. A hotter CPI print would reinforce the "higher for longer" Fed narrative, strengthening the dollar and pushing gold back toward the $5,052–$4,996 support cluster.
The bearish weekly correction scenario from Forex24.pro targets a pullback toward the $4,805 support zone before the next leg higher — a scenario consistent with the 61.8% Fibonacci retracement of the broader rally and the ascending channel's lower boundary. However, this is a weekly scenario, not a Monday one. Monday's day range is more conservatively forecast between $4,996 and $5,266, averaging $5,131.
Risk Scenarios to Monitor on Monday
- Weekend geopolitical news: Any escalation or de-escalation in Middle East tensions over the weekend will be immediately priced into Sunday evening's futures open. Escalation = gap up; de-escalation = gap down.
- DXY direction: Monitor the US Dollar Index at the open. A move below 103 is bullish for gold; a spike above 104 is bearish.
- Asian session liquidity: Early Monday sessions in gold can be low-liquidity environments with erratic price action — particularly dangerous for tight stop-losses. Consider waiting for the London open (7:00–8:00 AM GMT) before entering.
- 10-Year US Treasury yields: A decline in real yields extends gold's recovery; a spike in yields would cap any rally.
- Gap risk: Since gold markets were closed Saturday and Sunday, any significant weekend news could create an opening gap above or below Friday's close of $5,171. A gap above $5,208 would confirm bullish momentum; a gap below $5,107 would trigger the bearish scenario immediately.
Summary Signal Card
| Item | Details |
|---|---|
| Asset | XAU/USD (Spot Gold) |
| Date | Monday, 9 March 2026 |
| Current Price | ~$5,171 |
| Overall Bias | 🟡 Cautious Bullish |
| Primary Signal | 🟢 BUY dip: Entry $5,100–$5,130 |
| TP1 / TP2 / TP3 | $5,208 / $5,266 / $5,321 |
| Stop Loss (Long) | $5,052 |
| Alt. Signal | 🔴 SELL break: Entry below $5,107 |
| Alt. TP1 / TP2 | $5,052 / $4,996 |
| Stop Loss (Short) | $5,153 |
| Key RSI | ~44 (4H), bullish divergence |
| MACD | Rising, approaching zero — bullish |
| StochRSI | 8.9 — Oversold |
| Williams %R | -86.4 — Oversold |
| Key Upcoming Event | US CPI Feb — March 11 (HIGH IMPACT) |