A Serious Trader's Guide to Backtesting and Strategy Validation
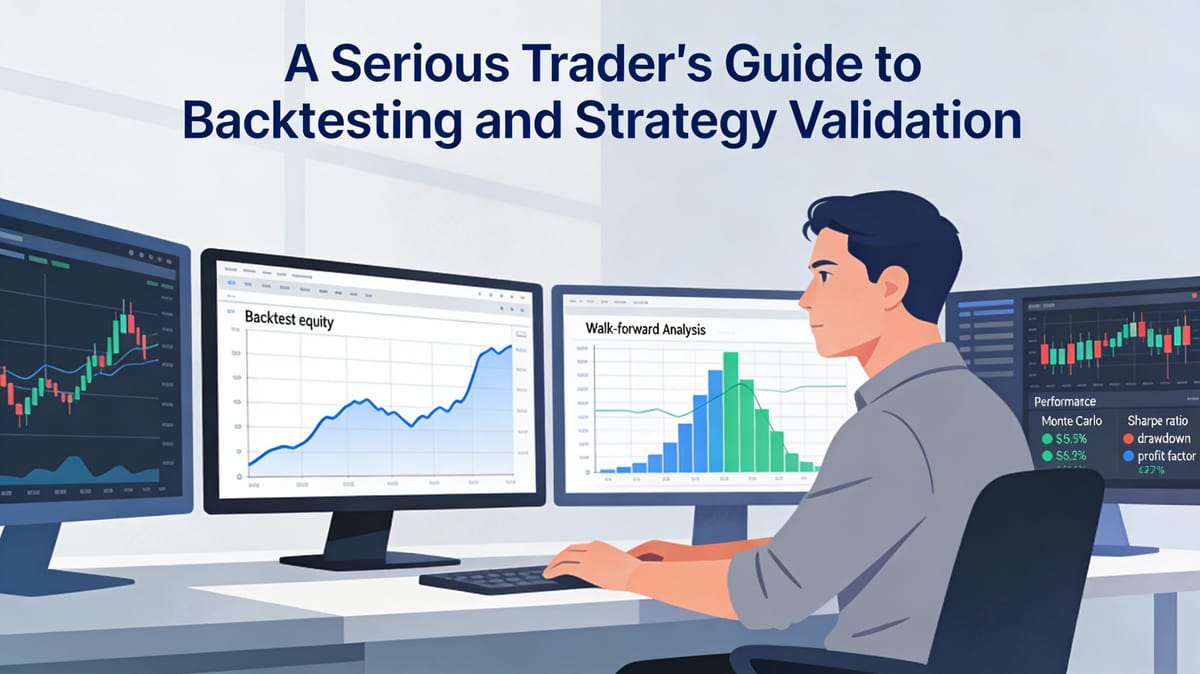
Backtesting is the cornerstone of professional trading strategy development, serving as the critical bridge between theoretical concepts and live market execution. Studies analyzing over 606,000 trades reveal that proper backtesting can boost return on investment by 30% by exposing fatal flaws before they cost real capital. Yet despite its importance, backtesting remains one of the most misunderstood and poorly executed aspects of trading, with countless traders falling victim to hidden biases and statistical traps that create illusions of profitability.
The Foundation: Defining Clear and Objective Rules
A robust backtest begins long before any historical data is analyzed—it starts with a well-defined strategy where every decision point is explicit and objective. Vague or inconsistent rules render backtest results meaningless, as discretionary interpretation introduces variables that cannot be accurately replicated or validated.
Essential Strategy Components
Every testable strategy must clearly define five critical elements:
- Setup criteria that identify when a trade is worth considering
- Entry rules that confirm precise execution points
- Stop-loss placement that manages risk on each position
- Take-profit targets that define exit conditions
- Trade filters that refine quality and eliminate suboptimal setups
The distinction between discretionary and systematic elements must be absolute. If a rule cannot be coded into an algorithm or followed by someone unfamiliar with your thinking, it needs further refinement. This level of precision not only enables accurate backtesting but also eliminates emotional decision-making during live trading.
Understanding Critical Backtesting Biases
The gap between backtested performance and live trading results often stems from systematic biases that inflate historical performance. Recognizing and mitigating these biases separates professional strategy development from amateur curve-fitting.
Survivorship Bias: The Invisible Graveyard
Survivorship bias occurs when backtesting only includes securities that currently exist, completely ignoring delisted, bankrupt, or failed companies. This creates a dramatically inflated picture of returns while underestimating true risk. A backtest conducted on today's S&P 500 constituents excludes hundreds of companies that failed over the testing period, presenting an unrealistically optimistic view of historical performance.
The solution requires using survivorship bias-free datasets that include all historical securities regardless of their current status. When testing on individual stocks, this means accessing databases that track delistings, mergers, and bankruptcies. The performance difference between biased and unbiased datasets can be substantial—often revealing that profitable-looking strategies would have generated significant losses when accounting for failed securities.
Look-Ahead Bias: Using Tomorrow's News Today
Look-ahead bias involves the unintentional use of information that would not have been available at the time a trade would have been executed. This subtle but devastating error can manifest in numerous ways: using end-of-day closing prices to generate signals that would require intraday execution, incorporating restated financial data, or applying technical indicators that require future price bars to calculate.
To eliminate look-ahead bias, approach each backtested trade as if you have absolutely no knowledge of future events. Adopt a systematic approach that selects assets and generates signals based solely on information available at that specific moment in time. This requires careful attention to data timestamps, calculation methodologies, and the realistic timing of information flow in actual markets.
Curve Fitting and Overfitting: Optimizing to Noise
Curve fitting represents perhaps the most insidious threat to strategy validity—optimizing parameters to fit historical noise rather than capturing true market behavior. When a strategy performs exceptionally well on historical data but fails dramatically in live trading, curve fitting is usually the culprit. The problem intensifies with parameter complexity: more parameters exponentially increase the probability of fitting noise rather than signal.
Recent research proposes comprehensive frameworks integrating cross-validation, stress testing, statistical testing, sensitivity analysis, and bootstrapping to detect parameter overfitting systematically. A Sharpe ratio above 3.0, while appearing attractive, often indicates overfitting rather than genuine edge. Simpler strategies with fewer parameters generally demonstrate greater robustness and longevity than complex systems optimized across multiple dimensions.
Data Snooping and Selection Bias
Data snooping bias emerges when repeatedly testing different strategies on the same dataset until one appears profitable. Each successive test increases the probability of finding spurious correlations that exist by chance rather than reflecting exploitable market inefficiencies. Similarly, selection bias occurs when testing only on assets, timeframes, or market conditions where you expect the strategy to succeed.
Professional traders combat these biases by documenting all tested variations, adjusting significance thresholds for multiple comparisons, and validating across diverse market environments. Testing across multiple currency pairs, timeframes, and market sessions exposes weaknesses that single-environment testing conceals.
Walk-Forward Analysis: The Gold Standard for Validation
Walk-forward analysis addresses overfitting by dividing historical data into sequential in-sample and out-of-sample periods. The methodology typically allocates 70% of data for in-sample optimization and reserves 30% for out-of-sample validation. Parameters are optimized using only in-sample data, then tested on the subsequent out-of-sample period without any adjustments.
This process rolls forward through the entire dataset, creating multiple independent validation periods. Modern platforms like TrendSpider have automated walk-forward engines that reduce overfitting by approximately 20%, a critical advantage given the regime shifts characterizing 2025 markets. The consistency of out-of-sample performance across multiple windows provides strong evidence of genuine edge versus parameter luck.
Walk-forward analysis also reveals parameter stability over time. If optimal parameters shift dramatically between successive windows, the strategy likely exploits temporary market conditions rather than persistent inefficiencies. Stable parameters across changing market environments indicate robust underlying logic.
Monte Carlo Simulation: Stress Testing Your Strategy
Monte Carlo analysis complements walk-forward testing by randomizing trade sequences to generate thousands of possible performance scenarios. While your backtest shows one specific sequence of trades, Monte Carlo simulation reveals the range of outcomes that could have occurred with different trade ordering.
Running 1,000+ randomized scenarios exposes the role of luck versus skill in your backtest results. If only a small percentage of randomized sequences achieve the performance of your actual backtest, luck may be playing an outsized role. Conversely, if most randomized sequences achieve similar results, your edge appears more robust.
Monte Carlo analysis also provides more realistic estimates of maximum drawdown and risk metrics. The worst drawdown in your backtest likely understates the true risk you'll face in live trading. Monte Carlo simulation identifies the range of potential drawdowns across different trade sequences, enabling more conservative risk management.
Essential Performance Metrics for Strategy Evaluation
Raw profitability tells only part of the story. Professional traders evaluate strategies across multiple dimensions that capture risk-adjusted returns, consistency, and drawdown characteristics.
Sharpe Ratio: Risk-Adjusted Returns
The Sharpe ratio measures return per unit of risk taken, calculated as (Average Return - Risk-Free Rate) / Standard Deviation. This metric enables direct comparison between strategies with different return profiles. A strategy generating 15% returns with 5% volatility (Sharpe ratio of 3.0) demonstrates superior risk-adjusted performance compared to a strategy with 20% returns but 15% volatility (Sharpe ratio of 1.33).
Interpretation guidelines suggest Sharpe ratios below 0.5 indicate poor performance, 1.0 to 2.0 represents good performance, and ratios between 1.5 and 2.0 meet institutional standards. However, ratios exceeding 3.0 warrant skepticism, often indicating overfitting rather than genuine edge. The Sharpe ratio can be improved by increasing profitability or decreasing volatility.
Maximum Drawdown: The Reality Check
Maximum drawdown measures the largest peak-to-trough decline during the backtest period. This metric reveals the psychological and financial stress you'll experience during inevitable losing streaks. Professional-grade strategies typically target maximum drawdowns below 20%.
Maximum drawdown directly impacts position sizing and leverage decisions. A strategy with 30% annual returns but 40% maximum drawdown requires substantial capital reserves and psychological fortitude. Many traders underestimate the emotional impact of large drawdowns, leading to strategy abandonment at precisely the wrong moment.
Profit Factor: Gross Profit Efficiency
Profit factor calculates the ratio of gross profit to gross loss. A profit factor of 1.0 indicates breakeven performance, as gains exactly offset losses. Values above 1.0 indicate profitability, with professional-grade systems typically achieving profit factors between 2.0 and 3.0.
This metric reveals the buffer your strategy has against transaction costs, slippage, and execution imperfections. A profit factor of 1.2 leaves minimal room for the real-world frictions absent from backtests. Profit factors above 1.8 provide comfortable margins for implementation challenges.
Win Rate and Risk-Reward Dynamics
Win rate represents the percentage of profitable trades, but must be evaluated alongside average win and loss sizes. A 40% win rate can generate excellent returns if average wins substantially exceed average losses. Conversely, an 80% win rate may prove disastrous if occasional losses dwarf accumulated gains.
The risk-to-reward ratio quantifies this relationship, representing the ratio of potential profit to potential loss per trade. Professional traders often target risk-reward ratios of 2:1 or better, ensuring that winning trades generate twice the profit of losing trades. This asymmetry enables profitability even with win rates below 50%.
Position Sizing: The Critical Link to Risk Management
Position sizing bridges the gap between strategy rules and portfolio risk management, determining capital allocation for each trade. This aspect is nearly as important as having positive expectancy, yet many traders neglect systematic position sizing in their backtests.
Common Position Sizing Approaches
Fixed fractional position sizing risks a consistent percentage of account equity per trade, automatically scaling position size with account growth or drawdowns. This approach provides natural drawdown protection, as position sizes decrease during losing streaks.
Volatility-based position sizing adjusts allocation according to asset volatility, typically measured using Average True Range (ATR). This methodology maintains consistent risk exposure across instruments with different volatility profiles, preventing over-concentration in volatile assets.
The Kelly Criterion provides a mathematical framework for optimal position sizing based on win rate and average win/loss ratios. The formula calculates: Optimal Position Size = (Win Rate / Average Loss) - 1. For a strategy with 60% win rate and 20% average loss, the Kelly Criterion suggests risking 2% per trade. However, many professionals use fractional Kelly (25-50% of full Kelly) to reduce volatility.
Backtesting Position Sizing Strategies
Testing different position sizing approaches across various market conditions reveals their effectiveness. Methods include tracking at least 30-50 paper trades with different position sizes, documenting emotional responses, analyzing recovery periods after drawdowns, and comparing fixed versus percentage-based versus volatility-adjusted approaches.
Backtesting should account for position sizing impact on strategy performance, risk per trade based on account size, and overall portfolio exposure. The optimal position size balances return maximization against drawdown control and psychological sustainability.
Best Practices for Robust Strategy Development
Achieving 85%+ forward viability—meaning live trading performance closely matches backtest expectations—requires disciplined adherence to validation protocols.
Use Sufficient Historical Data
Testing periods should span multiple market regimes, including bull markets, bear markets, high volatility, and low volatility environments. However, recent analysis suggests that 6 and 12-month backtesting periods can outperform 20-year results by focusing on current market dynamics while avoiding obsolete historical regimes.
The optimal lookback period balances statistical significance against market relevance. Strategies optimized on decade-old data may exploit conditions that no longer exist. Testing across shorter recent periods can reveal whether your edge persists in contemporary market structure.
Chronological Data Splitting
Always split data chronologically rather than randomly when creating training and validation sets. Random splitting introduces look-ahead bias by allowing the model to learn from future data. Chronological splitting mimics real-world conditions where future data is genuinely unknown.
This principle extends to all optimization and validation steps. Parameters optimized on recent data should never be tested on preceding periods. The temporal sequence must remain inviolate to ensure realistic performance estimates.
Out-of-Sample Validation
Reserve a substantial portion of historical data for out-of-sample testing that occurs only after all optimization is complete. This final validation period provides the most realistic estimate of future performance, as it uses data the strategy has never seen during development.
The temptation to peek at out-of-sample results during development must be resisted. Once you incorporate out-of-sample feedback into strategy adjustments, that data is no longer truly out-of-sample. Maintain discipline by setting aside this validation period and accessing it only once for final confirmation.
Document Everything
Maintain detailed logs of all tested variations, parameter combinations, and performance results. This documentation serves multiple purposes: preventing unintentional data snooping, identifying patterns across failed attempts, and providing audit trails for strategy review.
When refining strategies, isolate specific flaws, test targeted changes to one variable at a time, measure the impact on performance metrics, and iterate systematically. Random adjustments without documentation lead to unintentional curve fitting and obscure the source of any improvements.
Account for Transaction Costs and Slippage
Backtests conducted without realistic transaction costs and slippage assumptions create false profitability. Include commissions, spreads, market impact, and slippage estimates appropriate for your instrument, liquidity, and position size.
High-frequency strategies are particularly sensitive to execution quality. For scalping strategies, tick-level data becomes essential rather than optional. Free historical data often lacks the granularity needed for accurate testing of short-term strategies, making investment in quality data essential for serious traders.
The Reality Gap: From Backtest to Live Trading
Even perfectly executed backtests cannot replicate all aspects of live trading. The psychological pressure of real capital at risk, the need for real-time decision making, and unexpected market events create challenges absent from historical testing.
Start with small position sizes when transitioning to live trading, treating the initial period as final validation rather than full deployment. Document discrepancies between expected and actual performance, investigating whether differences stem from execution issues, market changes, or backtest flaws.
Accept that live performance will inevitably deviate from backtested expectations. The goal is not perfect replication but rather performance that falls within the range predicted by Monte Carlo analysis and validation testing. Significant underperformance warrants strategy review and potential suspension.
Conclusion
Backtesting and strategy validation represent far more than mechanical exercises in data analysis. They form the foundation of sustainable trading success, separating systematic profitability from gambling disguised as strategy. The serious trader approaches backtesting with scientific rigor, acknowledging that every shortcut creates risk and every bias introduces false confidence.
Walk-forward analysis, Monte Carlo simulation, proper bias mitigation, comprehensive metric evaluation, and systematic position sizing transform backtesting from box-checking exercise into genuine edge validation. The time invested in robust testing compounds across every subsequent trade, as strategies built on solid foundations withstand market shifts that destroy poorly validated approaches.
The frameworks and methodologies outlined here represent the minimum standards for professional strategy development. Markets continuously evolve, rendering static approaches obsolete. Serious traders commit to ongoing validation, regular strategy review, and relentless pursuit of methodological improvement. In the challenging arena of trading, proper backtesting and validation provide the only sustainable competitive advantage available to independent traders competing against institutional resources.

Comments ()